Data quality is a cornerstone of data governance and has a huge impact on the effectiveness and accuracy of business decisions. In this blog, we explain exactly what constitutes high-quality data and the measurements you can make to determine it.
When I was a kid, I remember going to the store to buy a new hard drive. When I asked the store manager how big it would be, he told me it would be one gigabyte.
I was amazed. A gigabyte felt unimaginably colossal back then, and I was sure we’d never fill it.
Today, my laptop is 500GB, my phone is 256GB, and it’s not uncommon for broadband speeds to reach 1GB per second.
And this is just a drop in the ocean.
IBM projected that by 2025, the amount of data created, consumed, copied, and stored would reach more than 180 zettabytes. To put that into context, a single zettabyte is the equivalent of a trillion gigabytes.
With such high volumes of data, it’s increasingly essential and increasingly difficult to maintain data quality.
By the end of this post, you will better understand what data quality is and the steps you can take to improve yours.
Definition of Data Quality
Perhaps one of the best-known definitions of data quality is “fitness for use for a specific purpose.” Yet, beyond this simple definition, you need to consider the steps you need to take to achieve it.
The definition implies that the data is suitable for achieving business goals, making informed and effective decisions on an ongoing basis, and optimizing future operations.
While this simple definition is a good starting point, it doesn’t inform how to approach data quality improvement for individual use cases. For that, you need more specifications.
Defining the quality of your data in an operational sense is about understanding how suitable your data is to serve a specific objective.
To that end, you should define data quality in context. For example, if your goal is to identify all of the paid invoices for May, your definition of high-quality data could be data that only represents paid, not pending invoices for that month, free from duplicates, and with corresponding invoice numbers.
Why is Data Quality Important
The quality of your data will directly impact your decision-making, analytics, and the tool's effectiveness if you’re developing software.
Imagine developing a new marketing strategy based on customer geography if you can’t be sure where your customers are located, what they’ve purchased, or if your records are flooded with duplicates.
Related Post: Best Practices for Improving Data Quality
New technologies are further increasing the importance of data and its quality. Technologies such as artificial intelligence and automation have enormous potential, but success with these technologies depends heavily on data quality.
Machine learning, for example, requires large volumes of accurate data. The more good data a machine learning algorithm has, the faster it can produce results, and the better those results will be.
Poor data can also lead to regulatory and ethical issues, as it’s harder to accurately review the data you store and prove you have been compliant. In this case, the direct penalties can be crippling to a business.
In a nutshell, if your data is of low quality, everything that relies on that data will be compromised. This can lead to costly mistakes, wasted time and money, and lost opportunities.
This is why inaccurate and low-quality data must be identified, documented, and fixed immediately.
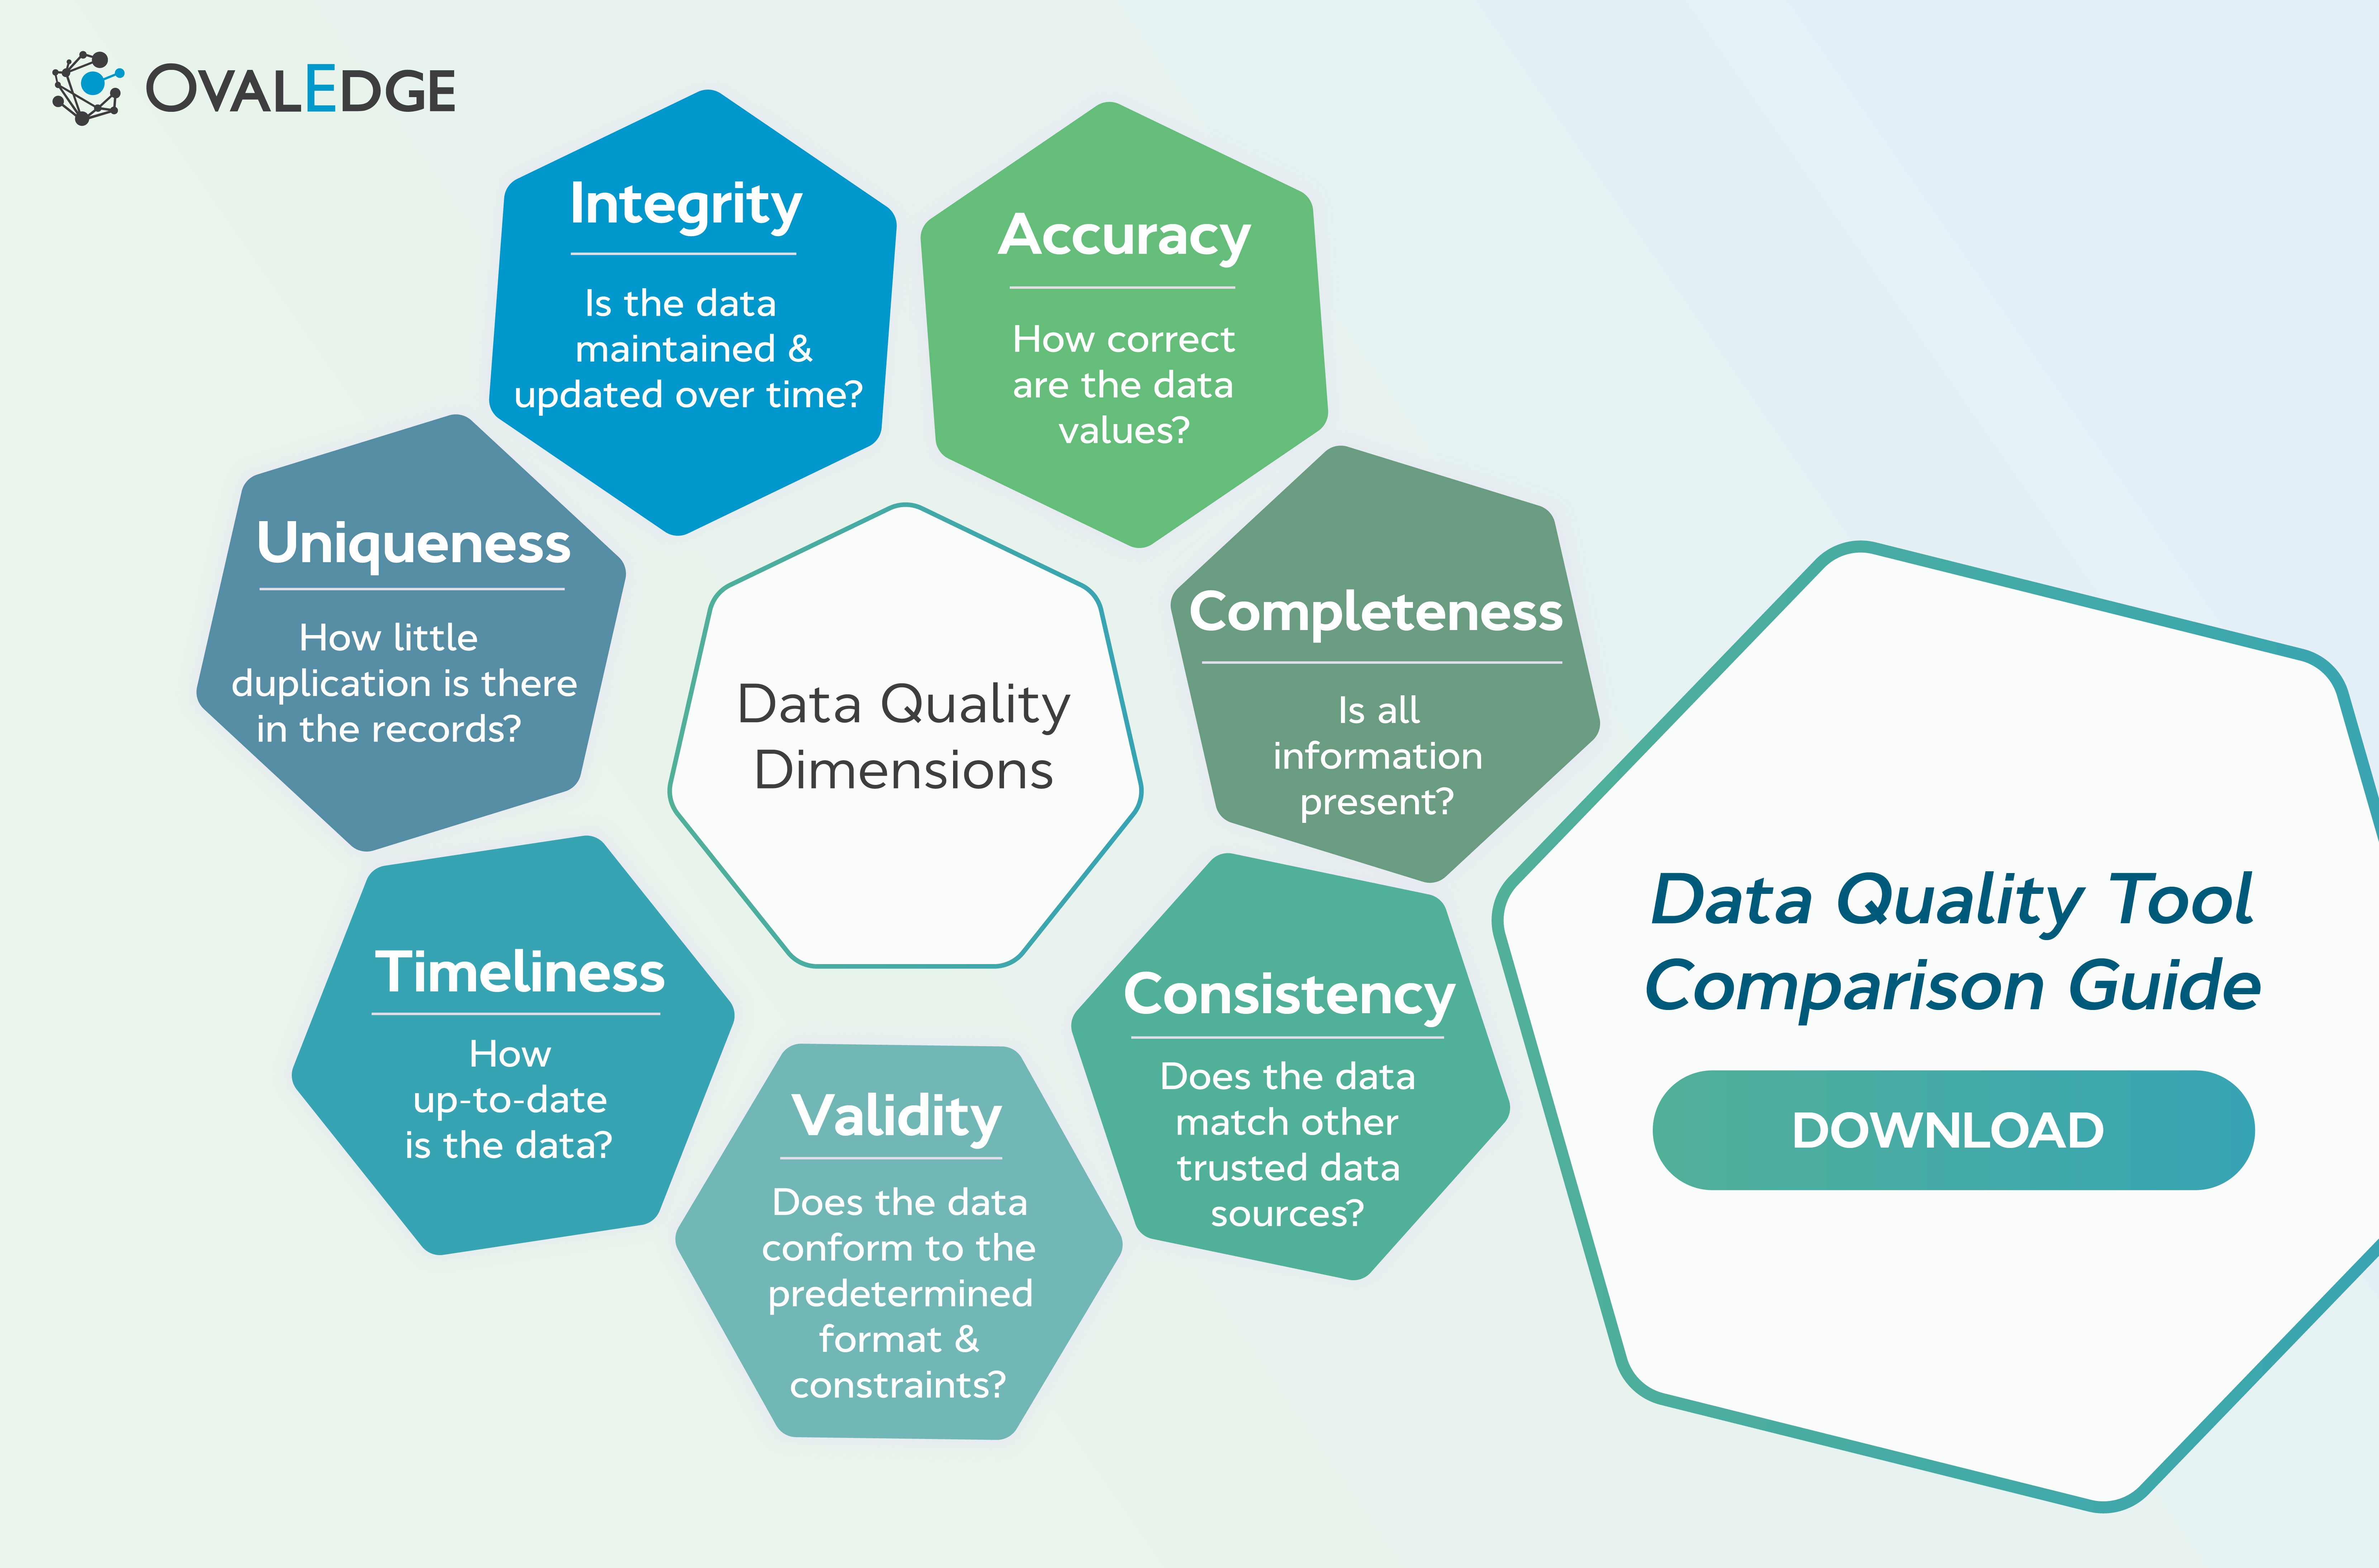
7 Metrics & Their Measurement Techniques
Here, we will walk you through the seven metrics for data quality and dimensions you need to consider when assessing data quality in your organization. They are:
- Accuracy
- Completeness
- Consistency
- Validity
- Timeliness
- Uniqueness
- Integrity
 Accuracy
Data accuracy measures the correctness and completeness of specific data. Essentially, you’re evaluating how much the information accurately reflects the event or object described.
The accuracy of your data is essential to avoid problems with transaction processing or generating faulty results in analytics.
Your decision-making is also dependent on high accuracy, as incorrect data will likely result in poor decisions.
Imagine forecasting your manufacturing budget based on data that inaccurately represents the number of units sold the previous year. A mistake like this could have serious financial consequences in the short and long term.
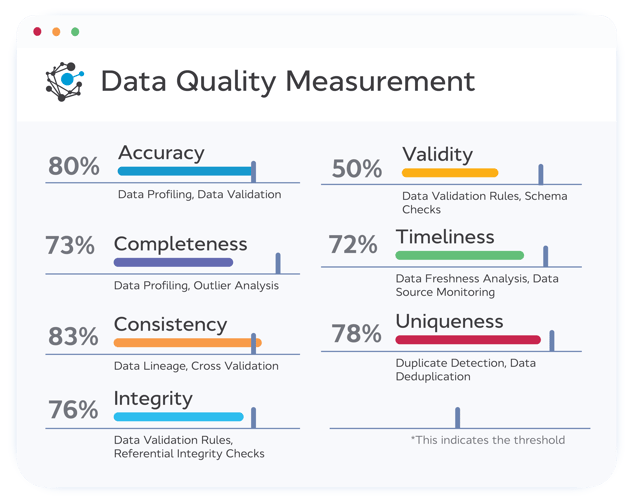
Two practical ways of evaluating data accuracy are data profiling and validation:
- Data profiling is the process of analyzing your data to identify inconsistencies, errors, and other anomalies.
- Data validation assesses your data to ensure it is accurate, complete, and consistent by checking it against predefined criteria. This process can be done manually, but it’s usually automated in modern digital environments, particularly where controlled data collection setups such as GTM server-side tagging are used to improve data reliability.
Related Post: Data Governance and Data Quality: Working Together
Completeness
The completeness of your data measures how many missing or null values there are. This can be at the individual data level, across tables, or the whole database.
Without this, you can’t be confident that you have all the data you need. And without this confidence, any output, analysis, or decision is inherently flawed.
You must ensure your data is complete and includes all critical information. Or, at the very least, you need to have a clear idea of what data you’re missing so you can account for it.
For example, when formulating a marketing plan, it’s important to know the demographic of your intended customer. If any important information like age, employment status, or location is missing, it would be impossible to create an accurate picture of your customer base.
You could end up spending time and money promoting a product to an audience that would never even consider purchasing it.
Similar to data accuracy, data profiling is a vital process in assessing your completeness.
Related: Emerging Data Quality Frameworks
The other significant way to assess your completeness is with outlier analysis:
- Outlier analysis is the process of identifying data points significantly different from the majority of data points in the same dataset. This process is useful because you can narrow your analysis solely to the data that stands out.
Consistency
When we talk about consistency, we’re talking about the uniformity of your data across various sources and platforms.
In software development, the consistency of the data will make a huge difference in the ability to utilize and process this data.
And at the decision-making level, consistency is important as you can directly compare data accurately without being confused by inconsistent or contradictory data.
For example, when referencing the United States, it's possible to input the name of the country in multiple ways, such as United States, United States of America, North America, USA, or US.
If various stakeholders use different definitions, say 25% use US, 25% USA, and 50% United States, additional processing steps are required before the data can be used for analytics.
Another example would be if the monthly profit number is inconsistent with the monthly revenue and cost numbers.
There are a couple of approaches for measuring the consistency of your data—lineage analysis and cross-validation.
- Data lineage involves tracking the origin and movement of the data across different locations and systems. The idea is to know exactly where your data has come from and identify any changes along the way.
- Cross-validation requires analysts to compare data from different sources to assess consistency.
Are you facing challenges in comprehending the flow of data within your cloud-based or on-premises infrastructure? Download our Whitepaper How to Build Data Lineage to Improve Quality and Enhance Trust
Validity
The validity of your data refers to the adherence to defined data formats and constraints.
For example, if you are storing dates, you need to define how these dates will be formatted. If you decide to use mm/dd/yy, then 04/18/1987 will be valid, but 18/04/1987 won’t.
Validity is significant because if you store many invalidly formatted data, you won’t be able to analyze or compare it easily. This is because invalid data would most likely be omitted from the results completely.
You can assess the validity of your data using data validation rules and schema checks.
- Data validation rules: These are a predefined set of rules to which the data can be compared. This is useful at the point of data creation.
- Schema checks: This process checks data against predefined data structures and criteria. This is more useful when reviewing and assessing pre-existing data.
Timeliness
Assessing timeliness involves measuring how up-to-date and relevant the data is. For example, if you have data about your company’s finances, it’s important to know if it’s from last week or from 2001.
This is significant in your decision-making process because things change all the time, and you need to be confident you’re not basing important business decisions on stale information.
The best ways to assess the timeliness of your data are with data freshness analysis and data source monitoring.
- Data freshness analysis: This involves analyzing how recently the data was uploaded or updated. Data
- Data source monitoring: This process concerns monitoring your data sources, so you can flag dated data and seek to update it.
Uniqueness
Data uniqueness is the measure of how distinct and non-repetitive data values are. Or, to put it in simpler terms, identifying and removing duplicate information and records.
This is important because duplicate data can conflate or mislead your decision-making process.
For example, if you have a sale recorded twice, then it will look like you’ve made more money than you really have, skewing your profit/loss calculations and projections.
You can avoid this using duplicate detection and data deduplication.
- Duplicate detection: This is about assessing and identifying duplicate records on existing or new data.
- Data deduplication: Often used alongside duplicate detection, this involves manually or automatically removing any duplicate data from a dataset.
Integrity
The integrity of your data is the measure of your data being accurate, consistent, and reliable over time.
For example, you might get your data to a certain quality now, but over the next few years, this could deteriorate as more data is added, modified, and deleted.
This is important to measure because if your integrity degrades, then your decision-making will inevitably suffer too.
Part of this assessment is the continued use of data validation rules as we covered for validity, but you’ll also want to carry out referential integrity checks.
- Referential integrity checks: This is about ensuring that changes made to data in one place are carried on and reflected in other places.
Commence your data quality tool evaluation with our Data Quality Feature Comparison Guide. Assess and compare features to find the best data quality solution that fits your specific needs. Download now.
Conclusion
In today’s data-driven world, maintaining your data is vital. Poor data can cost you time, money, and even your reputation. Hence, assessing your data quality for accuracy, completeness, consistency, validity, timeliness, uniqueness, and integrity is important.
By considering these metrics and acting on your findings, you can improve and maintain your data quality. It will help your company make better decisions and maintain a competitive advantage in your market.
FAQs
1. What is data quality and why is it important?
Data quality measures how accurate, complete, consistent, valid, timely, and reliable the data is. High-quality data enables better decisions, analytics, and insights, while poor data can cause errors and financial losses.
2. What are the key dimensions of data quality?
Data quality is evaluated across seven dimensions: accuracy, completeness, consistency, validity, timeliness, uniqueness, and integrity. These ensure data is correct, complete, uniform, up-to-date, non-duplicate, and reliable over time.
3. What are the 6 measurements for data quality?
The six core measurements are accuracy, completeness, consistency, validity, timeliness, and uniqueness. Measuring these ensures data is “fit for purpose” and supports reliable decision-making.
4. What are some examples of data quality metrics?
Common metrics include error rate, completeness rate, duplicate count, data freshness, validity ratio, and consistency ratio. Tracking these helps maintain accurate and reliable data.
5. How can organizations measure and assess data quality?
Organizations can use data profiling, validation rules, lineage analysis, duplicate detection, and outlier analysis to identify errors and maintain high-quality, reliable datasets.

.png?width=1081&height=173&name=Forrester%201%20(1).png)
.png?width=1081&height=241&name=KC%20-%20Logo%201%20(1).png)