Deliver
insights
Transform raw data into
business insights
Execute workshops with
agility and efficiency
Perform ad-hoc SQL analysis
with excel skills
A new way to transform your
raw data into Insights
Research, brainstorm and create in one visual, collaborative space.
Build your requirements fast
Start from exploring data, add the right data to your analytics project with
appropriate notes, collaborate at one common platform.
Use excel skills to build SQL.
Use single query editor to query
hundreds of databases
The analysts who are not SQL experts can build SQL with our spreadsheet-style interface.
Now you don't need to worry about connecting to different databases, downloading drivers for each of them. Use
the simple web interface of OvalEdge to query data. Those who are SQL experts can write their own queries.
Gather data from various systems
into a single data lake
Using Data Exchange, you can move data from various databases
into one common platform to do the ad-hoc analysis.
Use our light visualization capabilities
to picture your data
You can either use your favored tool or our basic visualization tool
to build infographics to understand data.
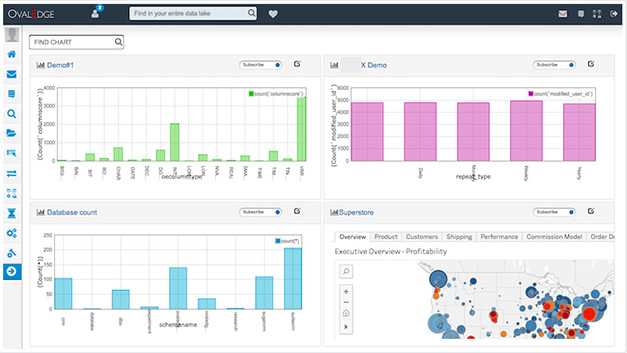
See OvalEdge in action
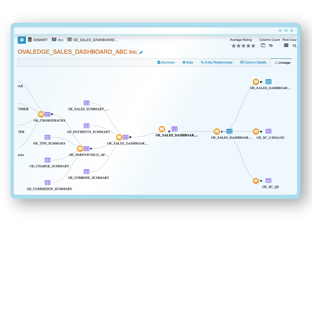
Draws lineage
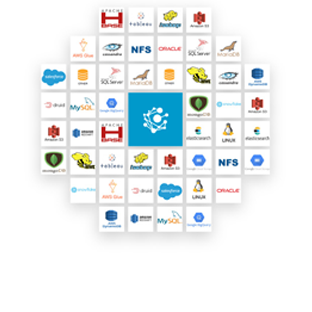
Indexes
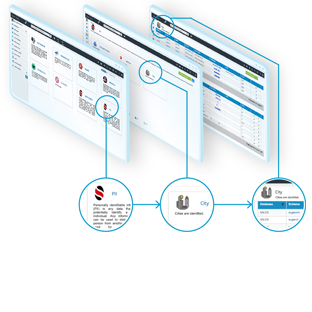
Organizes
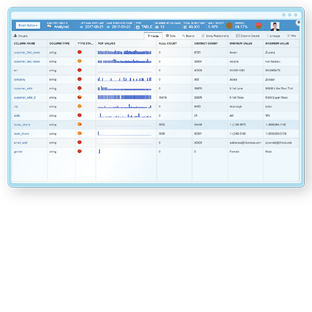
Summarizes
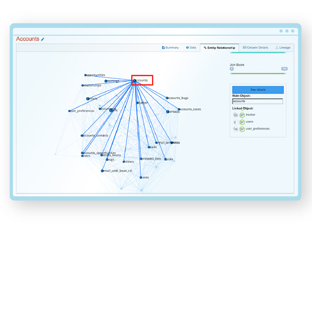
Marks relationship
OvalEdge recognized as a leader in data governance solutions
.png?width=1081&height=173&name=Forrester%201%20(1).png)
“Reference customers have repeatedly mentioned the great customer service they receive along with the support for their custom requirements, facilitating time to value. OvalEdge fits well with organizations prioritizing business user empowerment within their data governance strategy.”
.png?width=1081&height=241&name=KC%20-%20Logo%201%20(1).png)
“Reference customers have repeatedly mentioned the great customer service they receive along with the support for their custom requirements, facilitating time to value. OvalEdge fits well with organizations prioritizing business user empowerment within their data governance strategy.”
Gartner, Magic Quadrant for Data and Analytics Governance Platforms, January 2025
Gartner does not endorse any vendor, product or service depicted in its research publications, and does not advise technology users to select only those vendors with the highest ratings or other designation. Gartner research publications consist of the opinions of Gartner’s research organization and should not be construed as statements of fact. Gartner disclaims all warranties, expressed or implied, with respect to this research, including any warranties of merchantability or fitness for a particular purpose.
GARTNER and MAGIC QUADRANT are registered trademarks of Gartner, Inc. and/or its affiliates in the U.S. and internationally and are used herein with permission. All rights reserved.


