-2.png)
Poor-quality data can disrupt operations, distort forecasts, create compliance exposure, and reduce confidence in analytics and AI outputs.
According to Melissa’s 2025 State of Enterprise Data Quality survey, 84% of organizations experience measurable disruption due to poor data quality.
Duplicate records, missing fields, conflicting values, and outdated information can affect everything from customer engagement to regulatory reporting.
Data quality management helps organizations prevent these problems through continuous measurement, monitoring, ownership, and improvement. Unlike one-time cleansing, it establishes the rules, roles, and controls needed to keep data accurate, complete, consistent, timely, valid, and unique as systems and business requirements evolve.
This guide explains how data quality management works, the dimensions used to measure data, the five-step improvement lifecycle, and the practices needed to build a sustainable program.
What is data quality management?
Data quality management is the discipline of measuring, monitoring, maintaining, and improving data quality across the enterprise. It combines governance, stewardship, processes, and technology to ensure data remains fit for business use throughout its lifecycle.
Data quality management definition
Data quality management (DQM) is the set of practices organizations use to assess, improve, and sustain the quality of their data assets so information remains accurate, complete, consistent, timely, valid, and trustworthy wherever it is stored or consumed.
The distinction between data quality and data quality management is important:
-
Data quality is a state. It describes how well a dataset meets defined quality standards at a specific point in time.
-
Data quality management is an ongoing program. It combines governance, ownership, monitoring, and continuous improvement to maintain that quality as data changes.
Unlike one-time data cleansing initiatives, DQM is a continuous discipline. New records enter systems every day, business rules evolve, and data moves across applications. Without ongoing monitoring and accountability, quality improvements gradually decline over time.
A mature DQM program establishes a repeatable framework that enables organizations to:
-
Improve decision-making with trusted data.
-
Increase confidence in analytics and AI.
-
Strengthen compliance and reduce operational risk.
-
Detect and resolve quality issues before they affect downstream systems.
-
Treat data as a strategic business asset instead of a recurring technical problem.
As data ecosystems expand across cloud platforms, operational systems, data warehouses, and business applications, organizations need a structured approach that can scale with growing data volumes and complexity.
Data quality vs. data governance vs. data observability
Organizations often use data quality management, data governance, and data observability interchangeably. While they are closely connected, each serves a distinct purpose within a modern data strategy. Understanding how they work together helps organizations build a stronger foundation for trusted, reliable data.
|
Category |
Data quality management |
Data governance |
Data observability |
|
Purpose |
Improve and maintain the quality of enterprise data |
Establish policies, ownership, and accountability for data |
Monitor data systems and identify issues in real time |
|
Focus area |
Data itself |
People, processes, and policies |
Data pipelines and system health |
|
Business goal |
Ensure data is accurate, complete, consistent, and trustworthy |
Ensure data is managed responsibly and consistently |
Detect and resolve data incidents before they impact users |
|
Key questions answered |
Is our data reliable? |
Who owns the data and what standards apply? |
Has something gone wrong with our data? |
|
Primary stakeholders |
Data stewards, analysts, and data quality teams |
Data owners, governance councils, business leaders |
Data engineers, platform teams, operations teams |
|
Typical activities |
Profiling, validation, monitoring, and issue remediation |
Policy creation, stewardship, compliance management |
Anomaly detection, freshness monitoring, and incident alerting |
|
Success measure |
Higher trust in business data |
Strong accountability and compliance |
Faster detection and resolution of data issues |
In practice, these disciplines are most effective when they work together. Data governance establishes the rules and ownership structure. Data quality management ensures data meets those expectations. Data observability provides continuous visibility into the health of data systems and alerts teams when quality issues emerge.
Why data quality management matters for modern enterprises
Organizations increasingly depend on data to drive strategic decisions, automate business processes, and deliver personalized customer experiences. Poor-quality data undermines these efforts by introducing uncertainty and risk into critical business operations.
Across the enterprise, different teams rely on trusted data to achieve different business outcomes:
-
Analytics teams need reliable datasets to generate meaningful insights.
-
AI initiatives depend on high-quality training data to produce accurate and trustworthy outcomes.
-
Finance teams require accurate information for forecasting, budgeting, and reporting.
-
Customer-facing teams rely on complete and consistent records to deliver seamless customer experiences.
As enterprises generate and consume more data than ever before, manual quality management approaches become unsustainable. Organizations need scalable frameworks that combine governance, automation, and continuous monitoring to maintain trust in their data assets.
Ultimately, data quality management provides the foundation for making data-driven decisions with confidence.
The core dimensions of data quality
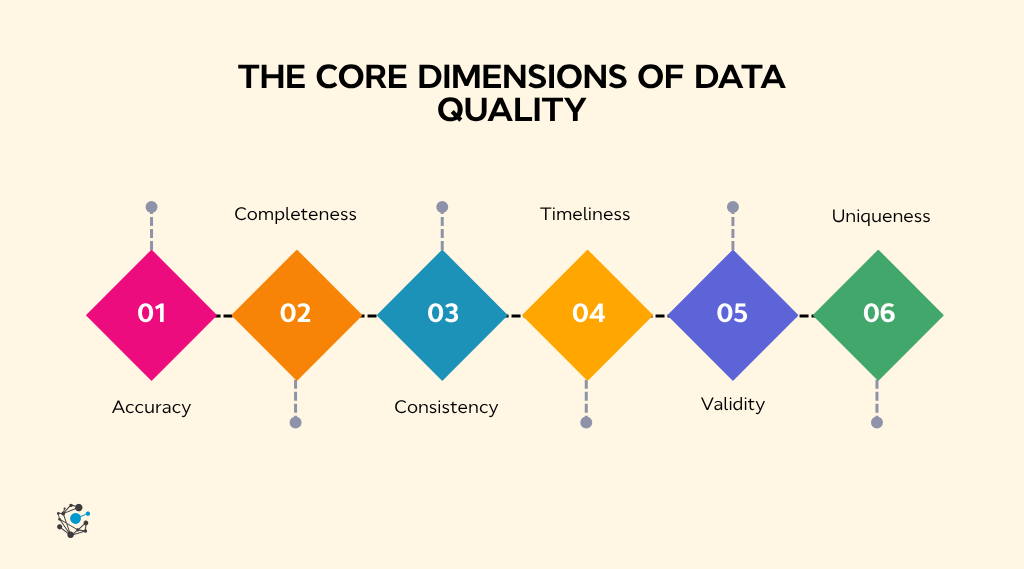
Data quality is measured through a common set of dimensions that help organizations evaluate whether data is fit for its intended purpose. These dimensions provide a consistent framework for defining quality expectations and monitoring performance.
|
Dimension |
What it answers |
Example quality check |
|
Accuracy |
Does the data correctly reflect reality? |
Compare records against a trusted source of truth. |
|
Completeness |
Is all required information available? |
Check that mandatory fields are populated. |
|
Consistency |
Is the same data consistent across systems? |
Compare shared records between CRM, ERP, and other systems. |
|
Timeliness |
Is the data current when it is needed? |
Measure refresh frequency against the defined SLA. |
|
Validity |
Does the data follow defined formats and business rules? |
Validate formats, ranges, and mandatory values. |
|
Uniqueness |
Is each entity represented only once? |
Identify and monitor duplicate records. |
Together, these six dimensions provide a consistent framework for evaluating whether enterprise data is fit for its intended purpose. The sections below explain each dimension in more detail, why it matters, and how organizations can improve it.
1. Accuracy
Accuracy measures whether data correctly reflects real-world conditions.
A customer address, account balance, inventory quantity, or transaction record should accurately represent reality. Inaccurate information often results from manual entry errors, synchronization issues, outdated records, or inadequate validation processes.
Poor accuracy can create significant business challenges. Sales teams may contact the wrong customers. Operations teams may make decisions based on incorrect inventory counts. Executives may rely on flawed reports when making strategic decisions.
Organizations typically measure accuracy by comparing records against trusted sources of truth. Data profiling, validation rules, and stewardship processes help improve accuracy over time.
2. Completeness
Completeness measures whether all required information is available.
Missing values often reduce the usefulness of data and limit downstream business processes. For example, missing customer contact information can impact marketing effectiveness, while incomplete product records can disrupt supply chain operations.
Organizations often establish completeness thresholds for critical datasets. These thresholds define the minimum acceptable percentage of populated fields and help identify areas requiring remediation.
Maintaining completeness ensures data consumers have the information they need to support decision-making and operational activities.
3. Consistency
Consistency evaluates whether data remains aligned across systems and business processes.
Customer information should match between CRM platforms, ERP systems, data warehouses, and reporting tools. When different systems contain conflicting information, trust in enterprise data begins to erode.
Consistency issues commonly arise from siloed systems, integration failures, duplicate processes, and inconsistent business definitions.
Organizations improve consistency through master data management, governance standards, integration controls, and ongoing monitoring.
4. Timeliness
Timeliness measures whether data is available when needed.
Even highly accurate data can lose value if it arrives too late to support business decisions. Organizations increasingly depend on near-real-time information to support operations, analytics, and customer experiences.
Timeliness is typically measured through data latency, refresh frequency, and service-level agreements. Monitoring freshness metrics helps ensure critical information remains current and actionable.
5. Validity
Validity determines whether data complies with established formats, rules, and business standards.
Examples include valid email addresses, approved product categories, acceptable transaction ranges, and mandatory field requirements. Validation controls prevent poor-quality data from entering systems and reduce downstream remediation efforts.
Organizations often implement automated validation rules to enforce standards consistently across data pipelines and applications.
6. Uniqueness
Uniqueness measures whether duplicate records exist within datasets.
Duplicate customer, supplier, employee, or product records create operational inefficiencies and reporting inaccuracies. They can also negatively impact customer experiences by creating conflicting communications and fragmented histories.
Organizations use matching algorithms, deduplication processes, stewardship workflows, and master data management practices to maintain uniqueness across critical business domains.
Common data quality issues and their business impact
Even organizations with mature data programs face recurring quality issues. In many cases, the same problem is identified in a report, corrected in that report, and then reappears during the next data refresh because the source issue was never resolved.
The following challenges generate the most remediation work and business disruption. While the symptoms differ, each one affects operational efficiency, reporting accuracy, regulatory compliance, or customer experience in measurable ways.
1. Duplicate and redundant records
The problem: Multiple records exist for the same customer, supplier, employee, or product.
Duplicate records create fragmented views of business entities, making it difficult to establish a single source of truth. They often arise from disconnected systems, inconsistent data entry practices, or mergers and acquisitions that introduce overlapping datasets.
Business impact:
-
Duplicate customer records inflate customer counts and distort KPIs such as average revenue per customer, customer lifetime value, and retention.
-
Marketing teams may send multiple communications to the same customer, increasing campaign costs and reducing engagement.
-
Sales and support teams lose time reconciling duplicate records instead of serving customers.
2. Missing and incomplete data
The problem: Critical fields contain blank, null, or unavailable values.
Missing customer contact information, product specifications, or financial classifications can significantly reduce the usefulness of data assets. These gaps often result from weak validation controls, manual processes, or inconsistent data collection methods.
Business impact:
-
Reports become less reliable because key metrics are calculated from incomplete datasets.
-
Automated workflows fail when mandatory fields are unavailable.
-
Analysts spend additional time locating or correcting missing information before reporting.
3. Inconsistent data across systems
The problem: The same data appears differently across applications and databases.
For example, a customer may have one address in a CRM system and a different address in an ERP platform. Product categories, business definitions, and financial metrics may also vary across systems.
Business impact:
-
Teams produce conflicting reports from different systems using the same business data.
-
Finance, operations, and sales spend significant time reconciling inconsistent records before making decisions.
-
Confidence in enterprise reporting declines as discrepancies become more frequent.
4. Outdated and stale information
The problem: Data is no longer current or relevant.
Customer contact information changes, inventory levels fluctuate, and business conditions evolve continuously. Without regular updates, organizations risk relying on information that no longer reflects reality.
Business impact:
-
Forecasts become less reliable when based on outdated information.
-
Customer communications reach incorrect recipients or use obsolete information.
-
Business decisions are delayed while teams verify whether data is still current.
5. Poorly governed data assets
The problem: Ownership, accountability, and quality standards are unclear.
When no individual or team is responsible for maintaining data quality, issues remain unresolved, and quality initiatives lose momentum. Poor governance often leads to inconsistent definitions, duplicate efforts, and limited visibility into quality performance.
Business impact:
-
Quality issues remain unresolved because ownership is unclear.
-
Different business units define and measure the same data differently.
-
Compliance and audit activities require more manual effort due to inconsistent governance practices.
The data quality management framework: A 5-step improvement lifecycle
Many organizations improve data quality only after issues become visible in reports or dashboards. A cleanup project resolves the immediate problem, but months later, the same issues often reappear because nothing changed at the source.
The Data Quality Improvement Lifecycle (DQIL) provides a structured, repeatable framework for breaking that cycle. Instead of treating quality issues as isolated incidents, it helps organizations identify problems, prioritize them based on business impact, resolve their root causes, and implement controls that prevent recurrence.
Each iteration strengthens data quality, making the overall program more effective over time.
|
Step |
What happens |
Primary owner(s) |
Outcome |
|
1. Identify |
Detect quality issues through profiling, business feedback, automated rules, or monitoring, and log them with business context. |
Business users, data stewards |
A centralized, prioritized issue backlog. |
|
2. Prioritize |
Rank issues based on business impact, downstream dependencies, customer impact, and regulatory risk. |
Data stewards, data owners |
A remediation plan focused on the highest-value issues. |
|
3. Analyze Root Cause |
Use data lineage and impact analysis to trace issues back to the source system, process, or transformation that introduced them. |
Data stewards, data engineers |
Root causes identified instead of treating symptoms. |
|
4. Improve |
Correct the issue at its source through process improvements, ETL updates, master data management, validation rules, or data corrections. |
Data engineers, business process owners |
Improved data quality and stronger operational processes. |
|
5. Control |
Establish monitoring rules, quality thresholds, alerts, and governance workflows to prevent the same issue from recurring. |
Data quality team, governance council |
Continuous monitoring and a closed improvement loop. |
Why the control step matters
Many organizations already perform the first four steps in some form. They detect issues, investigate them, identify the cause, and implement a fix. However, without a control mechanism, the same issue often resurfaces as new data enters the system or business processes change.
The control step transforms remediation into continuous improvement by ensuring every resolved issue results in a lasting safeguard. This typically includes:
-
Automated data quality rules to detect future violations.
-
Clearly assigned data owners and stewards.
-
Defined quality thresholds and escalation workflows.
-
Regular reviews to ensure controls remain effective.
This is where data quality management and data governance come together. Governance provides the ownership, accountability, and policies that enable quality improvements to last.
Common points where the lifecycle breaks down
Even mature organizations can struggle if one part of the lifecycle is missing. Common challenges include:
-
Issues are reported in multiple places: Problems raised through email, Slack, spreadsheets, or ticketing systems remain fragmented, making prioritization difficult.
-
Teams prioritize volume instead of business impact: Thousands of missing values may be less critical than a handful of errors affecting regulatory reporting or executive dashboards.
-
Root cause analysis stops too early: Teams correct downstream reports while leaving the source system unchanged, allowing the same issue to reappear.
-
Resolved issues never become preventive controls: Without new validation rules or monitoring, yesterday's fix becomes tomorrow's recurring problem.
Implementation tip: Treat DQIL as a continuous operational cycle rather than a one-time implementation project. Every completed iteration should reduce the number of recurring issues and improve trust in enterprise data.
How to implement data quality management step by step
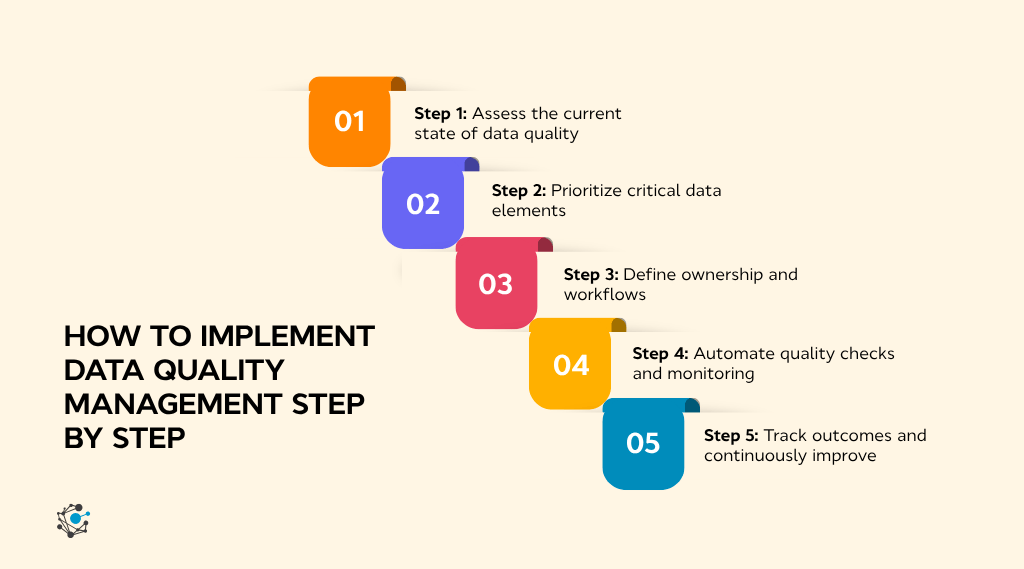
Implementing data quality management is not a one-time project. It is an ongoing process that combines people, processes, governance, and technology to improve data quality continuously. Organizations that follow a structured implementation approach are more likely to achieve measurable improvements and sustain them over time.
Step 1: Assess the current state of data quality
Before improving data quality, organizations need a clear understanding of their current challenges. This begins with profiling and assessing critical datasets to identify issues related to accuracy, completeness, consistency, validity, timeliness, and uniqueness.
A comprehensive assessment helps uncover hidden problems that may be affecting business performance. For example, profiling customer data may reveal duplicate records, incomplete contact information, or inconsistent values across systems. By establishing baseline metrics, organizations can quantify the extent of quality issues and prioritize improvement efforts more effectively.
The goal of this stage is to answer three questions:
-
Where are the quality issues?
-
How severe are they?
-
Which business processes are affected?
The output is a clear view of the organization's current data quality landscape and a foundation for future improvements.
Step 2: Prioritize critical data elements
Not all data has the same level of business importance. Attempting to improve every dataset simultaneously often leads to wasted effort and limited results. Instead, organizations should focus first on Critical Data Elements (CDEs) that have the greatest impact on operations, customer experience, compliance, and decision-making.
Examples of critical data elements include customer identifiers, product master data, supplier information, financial records, and regulatory reporting data. Poor quality in these areas can have direct business consequences, making them the highest priority for remediation.
Prioritization allows organizations to allocate resources strategically and demonstrate measurable value early in the program. It also helps establish realistic goals and creates momentum for broader quality initiatives.
Step 3: Define ownership and workflows
Data quality cannot improve without accountability. One of the most common reasons quality programs fail is that no individual or team is clearly responsible for maintaining data quality.
Organizations should establish a governance structure that includes data owners, data stewards, and data custodians. Each role should have clearly defined responsibilities for monitoring quality, investigating issues, approving changes, and enforcing standards.
In addition to assigning ownership, organizations should create standardized workflows for issue management. These workflows should define how issues are reported, prioritized, investigated, resolved, and validated. A structured process ensures quality concerns are addressed consistently and reduces the risk of recurring problems.
When accountability is clear, data quality becomes a shared business responsibility rather than a technical challenge assigned solely to IT teams.
Step 4: Automate quality checks and monitoring
As data volumes continue to grow, manual quality checks become increasingly difficult to maintain. Organizations need data quality tools that continuously monitor data quality and alert stakeholders when issues occur.
Automation can be used to validate business rules, detect anomalies, identify duplicates, monitor completeness, and track data freshness. For example, an automated rule may notify data stewards whenever customer records are created without mandatory contact information or when duplicate records exceed an acceptable threshold.
Continuous monitoring provides real-time visibility into data health and allows organizations to address problems before they impact business operations. It also reduces the effort required to maintain quality standards across large and complex data environments.
The more quality checks that can be automated, the more scalable and sustainable the program becomes.
Looking to automate data quality monitoring at scale?

Book a demo to see how OvalEdge helps teams monitor quality metrics, automate rules, and identify issues before they impact business operations.
Step 5: Track outcomes and continuously improve
Data quality management is a continuous improvement discipline rather than a one-time initiative. Organizations should establish measurable KPIs and scorecards to evaluate progress and demonstrate business value.
Common metrics include data quality scores, rule pass rates, duplicate record percentages, completeness levels, issue resolution times, and stewardship activity.
The right metrics help organizations move beyond fixing individual issues to improving data quality as an ongoing business capability. While target values vary by industry and data maturity, the KPIs below provide a practical starting point for measuring progress.
|
Metric |
What it measures |
Suggested benchmark |
|
Data quality score |
Overall health of a dataset across quality dimensions. |
Improve consistently from the baseline. |
|
Rule pass rate |
Percentage of quality rules successfully met. |
95%+ |
|
Completeness rate |
Required fields populated. |
98%+ for Critical Data Elements (CDEs). |
|
Duplicate rate |
Duplicate records within a dataset. |
<1% for master data. |
|
Data freshness |
Whether data meets agreed refresh SLAs. |
99% SLA compliance. |
|
Mean time to resolution (MTTR) |
Time taken to resolve quality issues. |
<10 business days for high-priority issues. |
|
Issue recurrence rate |
Frequency of previously resolved issues returning. |
<5% |
|
CDE coverage |
Critical Data Elements monitored by quality rules. |
100% over time. |
While all these KPIs are important, issue recurrence rate is often the clearest indicator of a mature data quality program. A low recurrence rate shows that teams are fixing root causes instead of repeatedly addressing the same issues.
Regular reviews allow organizations to identify trends, refine controls, and address emerging challenges. Over time, quality management shifts from reactive issue resolution to proactive prevention. As controls mature and governance strengthens, organizations spend less time correcting bad data and more time generating value from trusted information.
The most successful organizations treat data quality as an ongoing business capability that evolves alongside their data landscape and strategic objectives.
Data quality management best practices
Building a data quality management program is only the beginning. Long-term success depends on the habits and governance practices that keep data quality from deteriorating as new data, systems, and business requirements emerge.
The following best practices help organizations sustain improvements and maximize the value of their data quality initiatives.
1. Measure business impact, not just issue volume
Not every data quality issue deserves the same level of attention. Thousands of missing values in an archived dataset may have little business impact, while a handful of errors in regulatory or financial reporting data can create significant risk.
Prioritize remediation by considering:
-
Business impact.
-
Downstream reports and applications.
-
Customer experience.
-
Compliance and regulatory exposure.
Data lineage provides valuable context by showing where each data asset is consumed, helping teams focus on the issues that matter most.
2. Fix problems where they originate
Many organizations discover data quality issues in dashboards or reports and correct them there. While the report looks accurate again, the underlying data remains incorrect, allowing the same issue to spread across other systems.
Instead:
-
Correct data at the source.
-
Improve upstream business processes.
-
Validate downstream outputs to confirm the fix.
Addressing the root cause reduces recurring remediation work and improves trust across the entire data ecosystem.
3. Assign ownership to every critical data element
Quality initiatives lose momentum when accountability is shared across departments. Every Critical Data Element (CDE) should have a clearly identified owner responsible for defining quality expectations and approving remediation.
A well-defined owner should:
-
Establish acceptable quality thresholds.
-
Review and approve issue resolution.
-
Work with stewards to maintain ongoing quality.
Clear ownership turns data quality into a business responsibility rather than solely an IT initiative.
4. Set quality thresholds that drive action
Quality targets are valuable only if they lead to action. An ambitious threshold that nobody monitors provides little value, while a realistic target supported by automated alerts and clear escalation workflows helps teams respond before issues affect the business.
Effective thresholds should be:
-
Business-driven.
-
Measurable.
-
Continuously monitored.
-
Connected to defined remediation workflows.
5. Surface quality scores where people use data
Quality dashboards are useful, but analysts and business users make decisions inside data catalogs, BI tools, and operational systems—not governance dashboards.
Make quality visible where data is consumed by displaying:
-
Data quality scores.
-
Certification status.
-
Steward information.
-
Data freshness indicators.
Providing this context at the point of use helps users evaluate whether data is fit for their specific purpose.
6. Review quality rules regularly
Business processes, source systems, and regulations change over time. Rules that once detected meaningful issues can gradually become outdated, producing false positives or missing new quality risks.
Schedule regular reviews to:
-
Update validation rules.
-
Retire obsolete controls.
-
Add checks for new business requirements.
-
Improve monitoring coverage.
A quarterly review cycle helps ensure quality controls continue to reflect current business needs.
7. Focus on long-term trends
A single quality score provides only a snapshot. Trend reporting reveals whether the organization is making sustained progress or repeatedly solving the same problems.
Track metrics such as:
-
Overall data quality score.
-
Issue backlog.
-
Mean time to resolution.
-
Rule pass rate.
-
Issue recurrence rate.
Leadership is far more likely to support programs that demonstrate continuous improvement over time than isolated improvements in a single reporting period.
How data governance supports data quality management
Data quality management and data governance are closely connected. While data quality management focuses on measuring and improving data, governance provides the structure, accountability, and controls needed to sustain those improvements over time.
1. Roles and responsibilities
Data quality initiatives often fail when ownership is unclear. Governance defines who is responsible for maintaining data quality across the organization.
|
For example, a customer data owner may be accountable for defining quality expectations, while a data steward monitors quality metrics and resolves issues. Governance teams ensure these responsibilities are clearly documented and consistently applied. |
Clearly defined roles improve accountability, reduce delays in issue resolution, and prevent quality problems from being overlooked.
2. Policies, standards, and business rules
Data quality requires consistent standards across systems and business functions. Governance establishes the policies, naming conventions, validation rules, and quality thresholds that define what acceptable data looks like.
|
For example, a governance policy may require customer email addresses to follow a standard format and prevent records from being created without mandatory contact information. |
Standardized rules reduce ambiguity, improve consistency across systems, and ensure data quality is measured against the same criteria throughout the organization.
3. Data stewardship and accountability
Data stewards play a critical role in maintaining data quality on a day-to-day basis. They act as the link between governance policies and operational execution.
|
For example, if duplicate customer records are identified, a data steward may investigate the root cause, coordinate remediation efforts, and work with business teams to prevent the issue from recurring. |
A formal stewardship program ensures quality issues are actively managed rather than remaining unresolved across departments.
4. Regulatory compliance and risk management
Many industries must comply with regulations related to privacy, reporting accuracy, and data governance and compliance. Poor-quality data can lead to reporting errors, compliance violations, and increased business risk.
|
For example, inaccurate customer information can create GDPR compliance challenges, while incomplete financial records may affect regulatory reporting requirements. |
Governance helps organizations maintain documentation, enforce controls, track ownership, and demonstrate accountability. This reduces regulatory risk while strengthening overall data quality and trust in enterprise data.
How OvalEdge helps organizations improve data quality management
Improving data quality requires more than identifying errors. Organizations need a clear understanding of where issues originate, how they affect business processes, and what actions are needed to resolve them.
OvalEdge helps organizations operationalize data quality management by bringing data quality, governance, lineage, and stewardship into a unified platform. Teams can profile datasets, monitor quality metrics, define business rules, and track remediation activities from a single location, reducing the effort required to manage quality across multiple systems.
One of the biggest challenges in data quality management is determining the business impact of an issue. With integrated data lineage, cataloging, and business glossaries, OvalEdge helps teams trace issues to their source, understand affected reports and data assets, and prioritize remediation based on business impact.
This enables faster root-cause analysis and more informed decision-making.
Want to Build Trust in Enterprise Data?
Many organizations spend significant time correcting recurring data issues without addressing the underlying causes. Sustainable improvement requires a structured approach that connects governance, operational processes, and business accountability.
OvalEdge's Data Chaos to Data Trust whitepaper presents a practical four-pillar framework for improving data quality across data creation, operations, governance, and consumption. It outlines how organizations can reduce recurring quality issues, improve accountability, and establish consistent quality practices across the enterprise.
Conclusion
Data quality management is essential for organizations that rely on analytics, AI, and data-driven decision-making. By combining governance, accountability, monitoring, and continuous improvement, organizations can reduce risk, improve operational efficiency, and build greater confidence in their data.
The most successful organizations treat data quality as an ongoing business capability rather than a one-time initiative. With the right processes, ownership model, and technology, teams can proactively address issues, improve trust in critical data assets, and support long-term business growth.
Ready to take the next step? OvalEdge helps organizations improve data quality through integrated governance, stewardship, lineage, and monitoring capabilities.
Book a demo to see how OvalEdge can help you build a scalable and sustainable data quality management program.
.png?width=1081&height=173&name=Forrester%201%20(1).png)
.png?width=1081&height=241&name=KC%20-%20Logo%201%20(1).png)