Self-service business intelligence (BI) tools have transformed data accessibility, enabling non-technical users to independently analyze and visualize data. These tools empower decision-making by providing real-time insights, eliminating reliance on IT. The evolution towards Agentic BI takes this a step further, automating not only data analysis but also decision-making processes, integrating AI for predictive analytics and suggesting actionable steps. Tools like AskEdgi exemplify Agentic BI by interpreting natural language queries and automating responses, revolutionizing business workflows. This progression to Agentic BI promises enhanced efficiency and more proactive, data-driven decision-making in 2026 and beyond.
As a marketing manager, trying to make sense of data from a recent campaign can be a challenge. Your team is eager to understand customer behavior, but IT is tied up with other requests.
Days pass before you receive a report with a static set of insights, and by then, the data is already outdated. This delay can be frustrating and hinder timely decision-making.
Now, consider the same situation with self-service business intelligence (BI) tools. You log into your BI platform, quickly build a real-time dashboard, pull in all the relevant data, and generate actionable insights within minutes, without needing IT support.
Self-service BI tools are revolutionizing how organizations across industries access, analyze, and leverage data.
In this blog, we will explore how these tools work, the top platforms to consider in 2026, and how to implement them in your organization. Whether you're a small business owner or part of a larger enterprise, understanding these tools will empower you to make faster, data-driven decisions and boost overall efficiency.
What is a self-service business intelligence tool?
Self-service business intelligence (BI) tools empower users to independently access, analyze, and visualize data without relying on IT. These tools democratize data, enabling faster, data-driven decision-making across all levels of an organization.
Self-service BI platforms integrate with various data sources, automate reporting, and provide real-time insights, allowing users to create customized dashboards and reports.
With intuitive interfaces, users can perform advanced analytics and generate actionable insights quickly, making these tools ideal for both non-technical users and business professionals looking to leverage data for improved performance and efficiency.
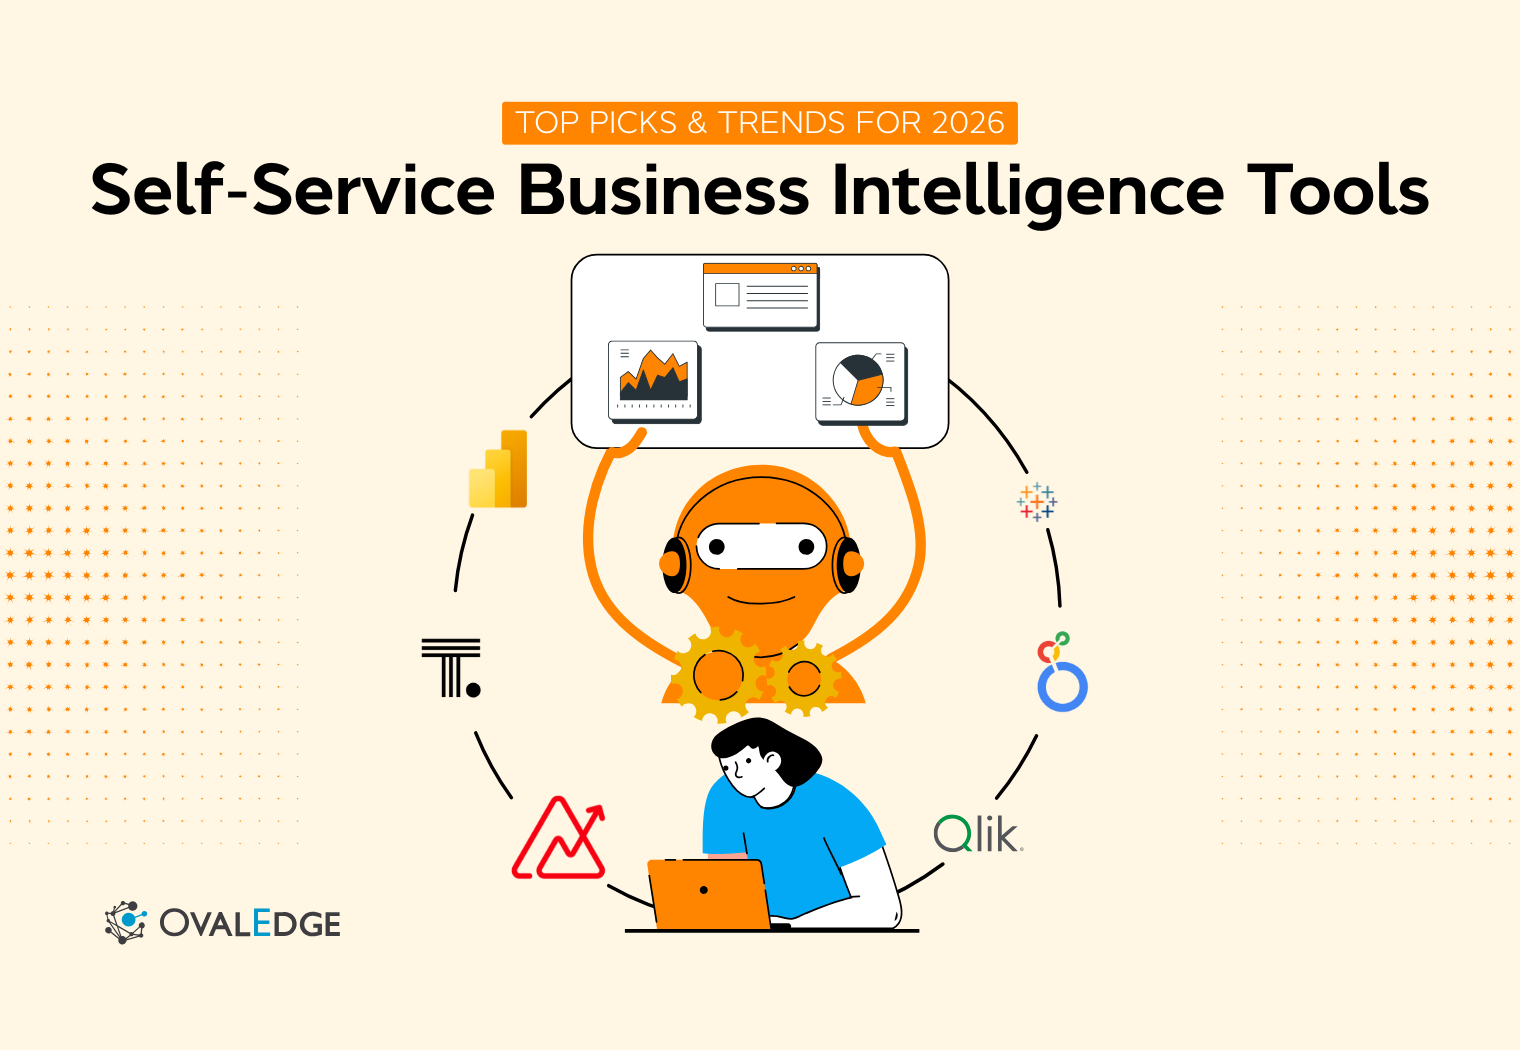
Top self-service BI tools to consider in 2026
As businesses increasingly require data-driven decision-making, self-service BI platforms are enabling non-technical users to take control of their data without relying on IT.
Here’s an in-depth look at the top self-service BI tools to consider in 2026, focusing on key features, pros, cons, pricing, and what each tool could improve.

1. Microsoft Power BI
Microsoft Power BI is a widely adopted business intelligence tool that provides intuitive data visualization, reporting, and dashboard-building capabilities. It’s part of the Microsoft suite, making it an ideal choice for businesses already using other Microsoft tools like Excel, Teams, and Azure.
Key features
-
Drag-and-drop reporting interface: Users can build custom reports with ease.
-
Seamless Excel integration: Easily integrate with existing Microsoft Excel spreadsheets and models.
-
Affordable pricing structure: Offers various pricing tiers suitable for different business sizes.
Pros
-
Integration with Microsoft ecosystem: Power BI integrates seamlessly with tools like Excel, Teams, and OneDrive, making it easy for organizations to leverage existing Microsoft products.
-
Cost-effective: Its pricing structure is accessible for both small businesses and large enterprises, with a free version and affordable paid options.
-
Wide adoption: It’s a popular choice for businesses worldwide, with a large support community.
Cons
-
Advanced features have a steep learning curve: While basic features are user-friendly, advanced analytics and formulas (such as DAX) may be challenging for non-technical users.
-
Limited capabilities in the free version: The free version of Power BI is quite limited, and many advanced features are reserved for premium users.
-
Data refresh limitations: Free users have limited data refresh rates, which can hinder real-time analytics.
Pricing
Microsoft Power BI offers Free, Pro ($14/user/month), Premium Per User ($24/user/month), and Embedded (variable) plans, providing scalable analytics capabilities based on sharing needs, data capacity, and enterprise features
Ratings
What it can improve
Many Power BI users express frustration over its manual processes and clunky interface. One common pain point is cleaning up models after prototyping, as leftover columns and measures can easily break the workflow.
Others struggle with reusing reports across datasets, where even slight changes in column names force them to rebuild the entire model. Users also highlight performance issues, like slow data updates and complex calculations that require workarounds.
Despite its potential, these persistent annoyances leave many wishing for a more intuitive and efficient experience. Improvements in usability and automation could make Power BI far more user-friendly.
2. Tableau
Tableau is a powerful and flexible self-service BI tool, primarily known for its advanced data visualization capabilities. It is especially favored by businesses that require visually compelling, interactive dashboards and data representations.
Key features
-
Advanced charts and graphs: Allows users to create complex, interactive visualizations.
-
Geographical mapping: Integrates geo-spatial data for location-based analysis.
-
Real-time data analysis
: Dashboards update dynamically with live data.
Pros
-
Superior visualization tools: Tableau is ideal for businesses that require high-quality, interactive data visualizations.
-
User-friendly interface: Despite its complex features, Tableau offers a clean, intuitive interface for creating beautiful dashboards.
-
Large community and support: Tableau has a vast community of users, developers, and consultants, making it easy to find resources and help.
Cons
-
Expensive: Tableau's pricing is on the higher end compared to other BI tools, which may be a deterrent for smaller businesses.
-
Steep learning curve: The tool’s advanced features require significant time and effort to master, particularly for new users.
-
Performance issues with large datasets: Tableau can struggle with performance when handling massive datasets or complex calculations.
Pricing
Tableau offers Creator, Explorer, and Viewer enterprise licenses with customizable packages. Pricing is available only via sales, covering analytics creation, exploration, and dashboard viewing with advanced data management options.
Ratings
What it can improve
Many users share frustration with Tableau’s clunky UX and the difficulty of completing basic tasks. One user mentioned spending hours trying to create simple charts, a task that takes minutes in Excel or Power BI.
The lack of intuitive navigation, limited styling options, and slow performance with large datasets are recurring complaints.
Despite its strengths, especially in visualization, these consistent issues lead many users to feel that Tableau is unnecessarily complex, especially when simpler, more efficient alternatives are available.
For enterprises, this can significantly slow down workflows, adding frustration to everyday tasks.
3. Looker
Looker is a cloud-native BI tool that excels at providing consistent, governed data across teams. It’s built for organizations that need to scale data analytics while ensuring that everyone in the organization is working from the same data model.
Key features
-
Semantic layer: Provides a consistent view of data, ensuring all teams use the same definitions and metrics.
-
Cloud-based platform: Fully cloud-native, offering scalability and flexibility for large enterprises.
-
Customizable dashboards: Allows for highly customizable and interactive visualizations.
Pros
-
Governed data models: Looker’s semantic layer ensures data consistency and governance across teams.
-
Scalable for large enterprises: Looker is ideal for organizations that need to handle large amounts of data and complex analytics.
-
Great integration with Google Cloud: As part of the Google Cloud ecosystem, Looker integrates seamlessly with other Google tools and services.
Cons
-
Requires technical setup: Looker’s full potential is unlocked only when custom data models are set up, which can require dedicated technical resources.
-
Expensive for small businesses: Looker is designed for large organizations, so its pricing may be prohibitive for smaller businesses.
-
Not as beginner-friendly: Its technical nature can make it challenging for non-technical users to get started.
Pricing
Google Cloud offers transparent, pay-as-you-go pricing with no upfront fees, $300 free credits, 20+ always-free products, cost-saving discounts, budgeting tools, and a calculator to estimate or customize costs.
Ratings
What it can improve
Users have voiced strong frustrations with Looker, especially around its slow performance and unintuitive interface. One user complained about the cumbersome process of dashboard creation, calling it “laborious” compared to other BI tools.
Others noted that Looker’s lack of basic styling options and bugs frequently disrupt workflows. The clunky UI and need for manual coding for new data columns left many users feeling drained.
While Looker does excel at data democratization and scalability, these ongoing issues hinder its effectiveness, especially for those seeking a more seamless, user-friendly experience.
4. Qlik Sense
Qlik Sense offers self-service analytics with a powerful associative engine that allows users to explore data dynamically. It’s designed for users who want to perform ad-hoc analysis and generate insights without relying on predefined reports.
Key features
-
Associative engine: Enables users to explore relationships between data points dynamically.
-
Self-service analytics: Non-technical users can generate their own insights without IT intervention.
-
Data exploration: Provides powerful search and filtering capabilities for data discovery.
Pros
-
Dynamic data exploration: Qlik Sense allows users to explore data freely, which is ideal for organizations that need to uncover hidden insights.
-
Powerful associative analytics: Its engine offers a unique way to visualize data relationships, leading to deeper insights.
-
Great for ad-hoc analysis: Users can explore data on-the-fly, without being restricted by predefined reports.
Cons
-
Requires technical knowledge: To fully leverage Qlik Sense’s features, users need some familiarity with data modeling and technical setups.
-
Complex interface: The user interface can feel cluttered, especially for new users.
-
Cost: While it offers powerful features, the pricing may be on the higher side for smaller businesses.
Pricing
Qlik Talend Cloud offers Starter, Standard, Premium, and Enterprise plans priced by data volume and usage, scaling from basic SaaS pipelines to advanced transformation, governance, AI-ready data management, and enterprise capabilities.
Ratings
What it can improve
Users have expressed frustration with QlikSense, particularly around its complexity and slowness. One user shared their challenge of reverse engineering chart scripts, which is both time-consuming and cumbersome.
While QlikSense is praised for its data load speed, it often falls short when it comes to visualization flexibility and ease of use compared to other BI tools like Power BI or Tableau.
Users also mentioned its configuration difficulties and bugs, making it harder for teams to efficiently analyze data. These pain points highlight areas where QlikSense could improve to better meet user needs.
5. Zoho Analytics
Zoho Analytics is a budget-friendly BI tool that caters to small and medium-sized businesses. It offers an easy-to-use platform with drag-and-drop reporting, AI-driven insights, and a wide range of integrations with third-party apps.
Key features
-
Drag-and-drop interface: Simplifies the process of creating reports and dashboards.
-
AI-driven insights: Uses machine learning to offer insights and recommendations.
-
500+ integrations: Works well with other Zoho products and third-party tools.
Pros
-
Affordable pricing: Zoho Analytics is an affordable option for small businesses and startups.
-
Quick setup: The tool is easy to set up and requires minimal training.
-
Strong integrations: Zoho integrates with over 500 third-party applications, which enhances its utility.
Cons
-
Limited scalability: Zoho Analytics may not be robust enough for large enterprises with complex data needs.
-
Basic data modeling: Lacks some of the advanced data modeling and transformation features available in other BI tools.
-
Performance issues: Can sometimes experience slower performance when handling large datasets.
Pricing
Zoho Analytics offers tiered plans, Free, Basic, Standard, Premium, and Enterprise, priced by users and data rows, with add-ons for viewers and storage, plus a 15-day free trial.
Ratings
What it can improve
Users have expressed frustration with Zoho Analytics, especially regarding its limited customization and the lack of user-friendly features. One user detailed their struggle with integrating Zoho People data for payroll purposes, where the tool’s inability to support essential customizations like time log flags led to cumbersome workarounds.
Despite these issues, the tool’s ability to integrate data from multiple sources remains a plus.
However, users feel that the overall user experience could be significantly improved to make it more intuitive and efficient, especially for complex tasks like payroll management and reporting automation.
6. ThoughtSpot
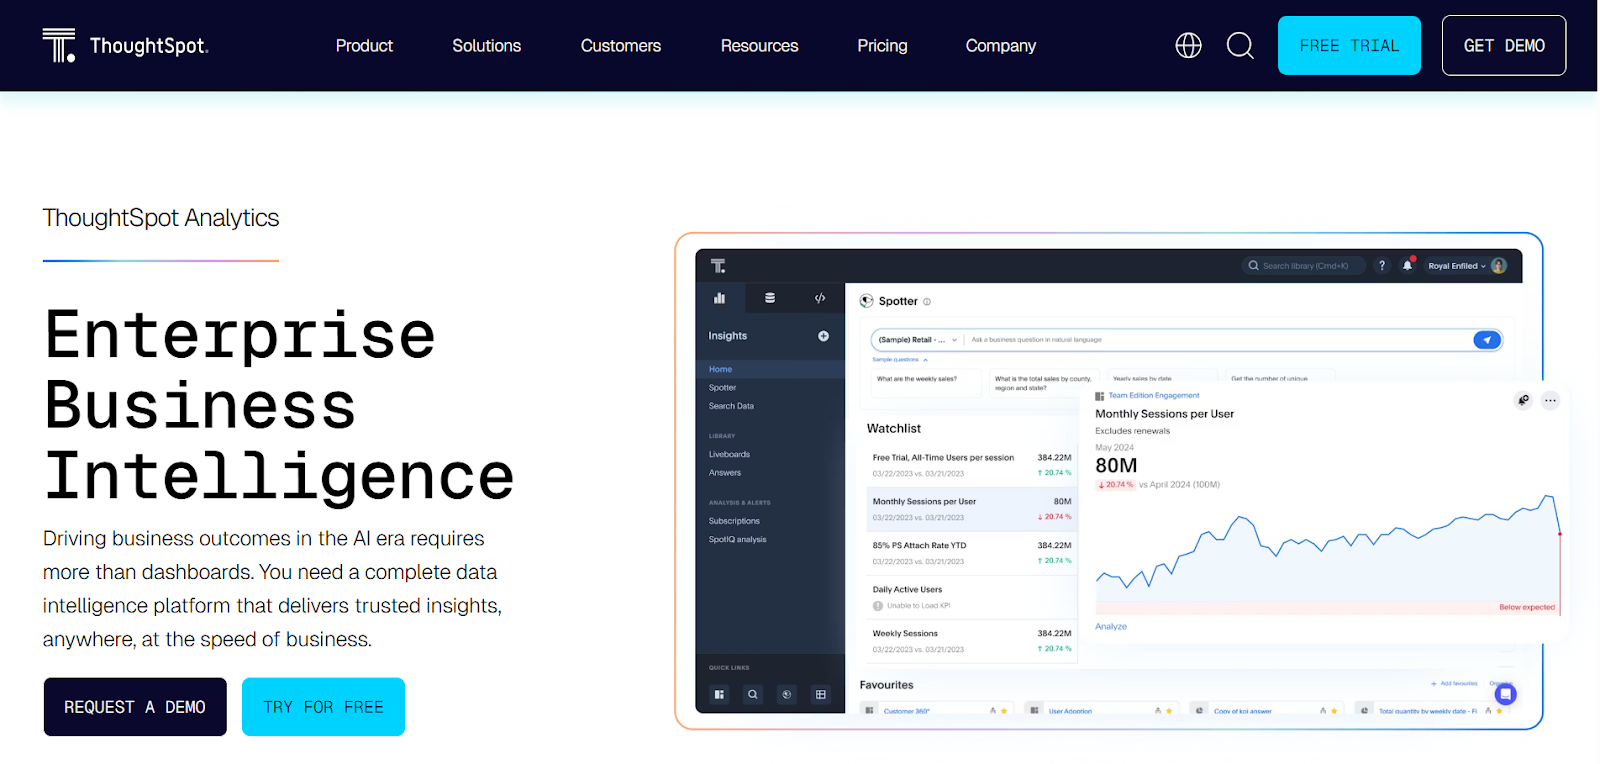
ThoughtSpot is a search-driven BI tool that uses AI to deliver insights and generate reports based on natural language queries. It’s designed for business users who need to quickly explore data without deep technical expertise.
Key features
-
Search-driven analytics: Users can generate insights by typing queries in natural language.
-
AI-powered insights: Uses machine learning to deliver automated insights and predictions.
-
Easy-to-use interface: ThoughtSpot’s interface is designed to be intuitive for non-technical users.
Pros
-
Natural language queries: Enables business users to get insights without needing to know SQL or complex query languages.
-
AI-powered automation: ThoughtSpot’s AI capabilities help uncover insights quickly and efficiently.
-
User-friendly interface: Non-technical users can easily navigate the platform.
Cons
-
Basic for larger organizations: While great for smaller teams, ThoughtSpot may not meet the needs of large enterprises with complex analytics requirements.
-
Limited customization: The level of customization available for dashboards and reports is more limited compared to other tools.
-
Pricing: The cost may be prohibitive for smaller teams or businesses.
Pricing
ThoughtSpot offers Essentials, Pro, and Enterprise plans priced primarily per user, starting at $50/user/month annually, scaling by data limits, AI capabilities, and enterprise-grade security, governance, and support features.
Ratings
What it can improve
When it comes to ThoughtSpot, users have been vocal about its shortcomings, particularly around visualization limitations and data modeling frustrations.
One user mentioned how the tool’s data joins are a pain to manage and that its visual options are restrictive, leaving much to be desired.
While it’s praised for its search functionality and the potential for non-technical users to run reports, it still struggles to meet expectations in terms of advanced customization and efficiency.
These points highlight areas where ThoughtSpot could seriously improve to meet the needs of a broader audience.
Whether you're a small business owner or part of a large enterprise, selecting the right tool depends on your organization’s size, data complexity, and budget.
By understanding the features, pros, cons, and potential areas for improvement, you can make an informed decision on the best tool to empower your team with data-driven insights in 2026.
How do self-service BI tools work?
Self-service business intelligence (BI) tools have revolutionized how organizations approach data analysis.
By empowering non-technical users to access, analyze, and visualize data without relying on IT departments, these tools significantly enhance decision-making speed and data accessibility across the organization.
Let’s break down the key functionalities that make self-service BI tools effective, focusing on how they operate in practice, and how businesses can maximize their value.
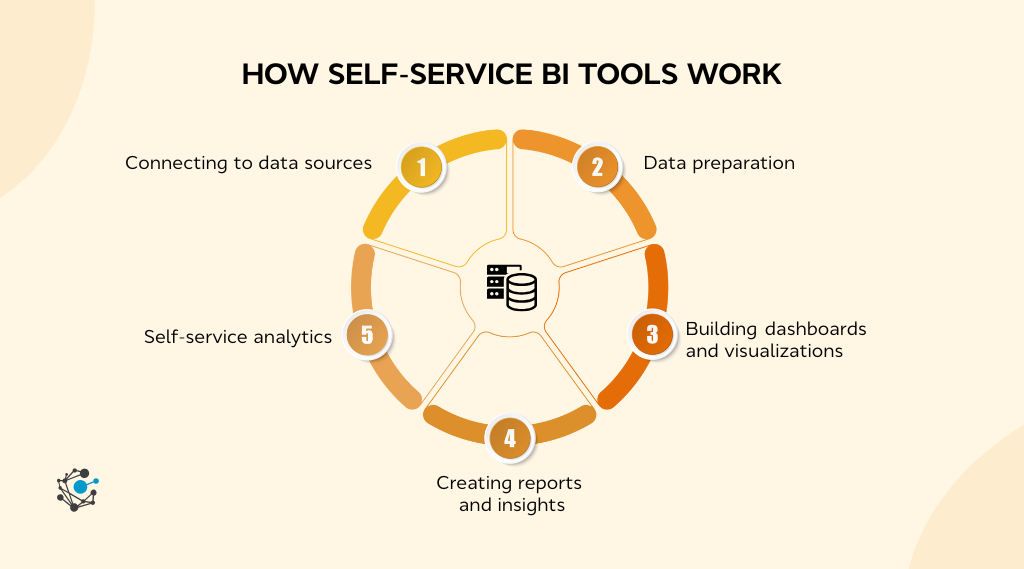
1. Connecting to data sources
One of the most crucial aspects of self-service BI tools is their ability to connect to multiple data sources.
Unlike traditional BI tools, which often require manual data extraction and technical interventions, self-service BI tools make it easy for users to pull data directly from a wide variety of sources, whether on-premise or cloud-based.
Self-service BI tools come equipped with connectors for different types of databases, cloud services, and third-party applications. Common integrations include sources like:
-
Cloud services: Google Analytics, AWS, Microsoft Azure, and other cloud platforms.
-
CRM and ERP systems: Salesforce, HubSpot, SAP, and Oracle.
-
Databases: SQL Server, MySQL, PostgreSQL, and other relational databases.
-
File-based data: Spreadsheets, CSV, and Excel files are often used to import data from more static sources.
By simply logging into the BI tool, users can easily integrate these data sources with minimal technical expertise. This eliminates the need for data silos, and enables organizations to get a holistic view of their data, regardless of its location.
|
For example, a marketing team might want to analyze website traffic, conversion rates, and lead generation performance. With a self-service BI tool, the team can connect their Google Analytics, CRM, and email marketing platforms directly to the tool, creating a unified data set without needing to ask IT for help. This allows for faster decision-making since the marketing team can continuously monitor performance in real-time. |
2. Data preparation
Once data is connected to a self-service BI tool, it often requires cleaning, transforming, and merging before it is ready for analysis. This stage ensures that the data is consistent, accurate, and formatted properly to avoid misinterpretations or analysis errors.
Data preparation in self-service BI tools includes several critical steps:
-
Data cleaning: This step eliminates issues such as duplicate entries, missing data, and inconsistencies across datasets.
|
For example, a CRM system might have customer records that contain missing values for email addresses, which need to be flagged and addressed. |
-
Data normalization: Often, data pulled from different sources will use different formats or units. Self-service BI tools help normalize these differences (e.g., converting all sales figures into the same currency) to create consistency across reports.
This normalization process becomes even more crucial when considering that, according to a 2024 McKinsey’s Master Data Management survey, 80% of organizations report operating with siloed, inconsistent data across divisions.
This lack of data consistency not only hampers decision-making but also highlights the critical need for effective data governance and normalization processes, which ensure that data from various sources aligns seamlessly, making reports more accurate and actionable.
-
Merging data: Combining data from multiple sources, such as merging sales performance data from a CRM system with marketing campaign performance data from Google Analytics, is a critical step. BI tools help users to easily map and join these data points into a unified dataset for analysis.
|
Consider an e-commerce company that pulls customer purchase data from its payment gateway and customer interactions from its CRM. The data may need to be merged and normalized to ensure that customer IDs match up between the two systems. Self-service BI tools like Power BI or Tableau provide an intuitive interface that allows users to link data from these two sources seamlessly without writing complex SQL queries. |
For non-technical users, manual data cleaning can be cumbersome and prone to errors. Self-service BI tools mitigate this by offering built-in features such as automated data cleaning, reducing human error, and making data preparation easier for all users.
3. Building dashboards and visualizations
Data visualization is at the core of self-service BI tools, allowing users to transform complex datasets into meaningful visual representations that highlight trends, patterns, and key insights.
Building custom dashboards is typically as easy as dragging and dropping data elements into pre-built templates.
Self-service BI tools like Power BI and Tableau provide users with a wide range of chart types, including:
-
Bar, line, and pie charts: Basic visualizations that represent data trends, distributions, and proportions.
-
Geographical maps: Useful for mapping sales data by region or customer locations.
-
Heatmaps: Allow users to identify areas of high and low activity or interest.
These visualizations are interactive, enabling users to drill down into the data for more granular insights. Users can create multi-page dashboards that are customized to specific business needs, which can be shared across teams or embedded in reports.
|
For example, a sales manager could use Tableau to create a dashboard that tracks monthly sales by region. They might use bar charts to show performance by territory and a map to display sales volumes by location. This allows for quick, actionable insights, such as identifying which regions need more focus or resource allocation. |
4. Creating reports and insights
Another powerful feature of self-service BI tools is the ability to generate reports and actionable insights. Once data is cleaned, connected, and visualized, users can create customized reports that reflect the specific needs of the business or project.
-
Automated reports: Many self-service BI tools allow users to automate report generation. These reports can be scheduled to run periodically (daily, weekly, monthly) or triggered by specific data events.
-
Custom reports: Users can design their own reports, selecting the metrics, charts, and KPIs that are most relevant to them. These can then be exported into formats like PDF or Excel for distribution.
-
Real-time updates: With real-time data connections, reports and dashboards are automatically updated as new data comes in, ensuring that business decisions are based on the latest available information.
|
For instance, a financial analyst might create a monthly performance report that compares revenue, expenses, and profit margins across different business units. This report is automatically generated at the end of each month, reducing the need for manual calculations and report building. |
5. Self-service analytics
One of the most significant advantages of self-service BI tools is that they allow non-technical users to perform their own analysis, eliminating the need to wait for IT or data specialists.
This level of autonomy enables teams to generate insights at the moment they are needed, which is crucial in fast-paced business environments.
Self-service analytics allows users to run queries on data using simple interfaces. Some tools even allow natural language querying, where users can ask questions like “What were the total sales for Q1?” and receive instant answers.
More advanced queries may require basic knowledge of data fields, but most BI tools offer simplified query-building options for ease of use.
-
Ad-hoc analysis: Users can ask specific questions about their data, such as “Which product category had the highest sales last month?”
-
Natural language processing: Tools like ThoughtSpot enable users to type queries in natural language, eliminating the need for complex query writing.
Self-service BI tools are essential for modern organizations looking to empower non-technical users with data insights.
They streamline the process of connecting to data sources, cleaning and preparing data, building visualizations, and generating reports. Most importantly, they allow users to run their own analyses, cutting down on dependency from IT teams and accelerating decision-making.
How to choose the right self-service BI tool for your organization
With so many options available, selecting the best tool for your needs requires careful consideration of various factors that ensure the platform fits seamlessly into your business environment.
A few key considerations when choosing a self-service BI tool:
1. Ease of use
For a BI tool to truly be "self-service," it must be easy to use and intuitive, so that even users without a technical background can quickly understand how to create reports, build dashboards, and extract insights.
If the tool is too complicated or requires extensive technical expertise, it defeats the purpose of a self-service BI platform. In these cases, users may become frustrated and either stop using the tool or rely on IT support, which undermines the agility that self-service BI tools are meant to provide.
How to evaluate:
-
User interface (UI): The platform should have a clean, organized layout with easy-to-navigate menus.
-
Training and support: Does the tool offer user-friendly tutorials, community forums, and customer support to guide users through the learning process?
-
Customization options: Evaluate how easy it is to modify reports and dashboards to suit the specific needs of different teams or departments.
2. Data integration
Self-service BI tools are only as effective as their ability to integrate with your data sources. In most organizations, data is spread across multiple systems, whether that’s CRM tools, marketing platforms, cloud storage, or on-premise databases.
The BI tool you choose must seamlessly connect to these systems to provide a unified view of your business performance.
According to a 2025 Gartner report on Data Integration Practices, mature data integration practices are essential for consistent data access and delivery across diverse sources, highlighting how integration and governance underpin high‑quality analytics and BI workflows.
Without solid integration and governance, even the best BI tools will struggle to provide accurate, unified insights.
If your BI tool cannot integrate with the necessary data sources, it becomes an isolated system, making it difficult to gain comprehensive insights. Moreover, data integration failures can lead to errors in reporting and analysis.
-
Supported data sources: Ensure the tool can connect to your CRM, ERP, marketing automation tools, databases, and cloud-based applications.
-
Real-Time data syncing: Can the tool pull data in real-time or does it require batch updates? Real-time data syncing ensures your reports and dashboards reflect the most up-to-date information.
-
APIs and third-party connectors: Does the BI tool provide APIs or pre-built connectors for easy integration with your existing software stack?
3. Scalability
As your organization grows, so too will the volume of data you need to analyze. The self-service BI tool you select should be able to scale along with your business, both in terms of data volume and the number of users who will rely on it.
A scalable BI tool ensures you can continue to generate insights even as data grows more complex.
Choosing a tool that cannot scale with your business will result in performance issues, such as slow load times, errors in reporting, and a frustrating user experience. Moreover, your tool will quickly become obsolete as your data needs evolve.
-
Data volume: Can the tool handle large datasets without significant performance degradation?
-
User capacity: Will the BI tool remain responsive as more employees or departments begin using it?
-
Cloud vs. on-premise: Cloud-based tools typically offer better scalability due to their flexible infrastructure, whereas on-premise solutions may require additional resources to scale.
4. Security
Security is a critical concern when dealing with sensitive data. You need to ensure that the BI tool you choose has robust security features to protect both the data being analyzed and the access control for various user roles.
Data breaches or non-compliance with regulatory standards like GDPR could have severe consequences for your organization.
BI tools often deal with confidential business and customer data. Without proper security, unauthorized access or data leaks could result in financial loss, legal repercussions, and a loss of trust from customers and stakeholders.
-
User permissions: Ensure the tool allows for granular control over who can access what data. Look for role-based access control (RBAC) features.
-
Data encryption: Does the tool encrypt data both in transit and at rest to ensure that sensitive information is protected?
-
Compliance: Does the tool comply with industry standards and regulations, such as GDPR, HIPAA, or SOC 2?
5. Cost
Cost is always a consideration when selecting a BI tool. While it’s important to invest in a tool that meets your needs, you also need to ensure that it fits within your budget. This includes upfront licensing costs, ongoing subscription fees, training expenses, and any hidden costs associated with scaling the tool.
Overpaying for a BI tool that provides more functionality than needed can be a significant drain on resources. Alternatively, underinvesting in a tool that lacks necessary features or scalability can lead to inefficiencies and hinder business growth.
-
Licensing model: Evaluate whether the tool offers a pay-per-user model or a flat rate. Consider how pricing changes as your organization scales.
-
Hidden costs: Are there additional costs for integrating third-party applications, adding users, or unlocking premium features?
-
Free trials and demos: Many BI tools offer free trials or demos. Take advantage of these to ensure the tool fits your organization’s needs before committing.
Evaluating based on organizational size & needs
When selecting a self-service BI tool, it’s essential to consider your organization's size and specific needs. The right tool will vary depending on factors like data volume, user requirements, and scalability.
Here’s how to evaluate options based on your business context.
Small business
For small businesses, cost-effectiveness and ease of use are paramount. These organizations often have limited budgets and staff, so selecting a tool that is both affordable and simple to implement is crucial.
Tools like Zoho Analytics provide an excellent entry point, offering powerful features at a lower price point and a user-friendly interface that doesn't require technical expertise.
Medium enterprise
As businesses grow, so do their data needs. Medium enterprises require tools that not only offer self-service capabilities but can also scale with increased data volume and user adoption.
Solutions like Power BI and Qlik Sense are ideal for this segment, providing flexibility, scalability, and strong integration capabilities with various data sources.
Large enterprise
For large enterprises, robust functionality, strong data governance, and advanced security are critical.
Tools like Tableau and Looker excel in this area, offering deep customization, enterprise-grade scalability, and strong support for complex, cross-departmental data analysis.
Implementing a self-service BI tool
Once you’ve selected the right self-service BI tool, the next step is a successful implementation. This phase is crucial in ensuring the tool’s value is realized across your organization.
Here are a few key steps to ensure successful implementation:
-
Data readiness: Clean and standardize your data before importing it into the BI tool. This ensures that the insights derived from the tool are accurate and reliable. Develop a clear data management strategy to maintain data quality.
-
Training and adoption: Offer training sessions to all team members who will use the tool. Ensure they understand how to navigate the platform, create reports, and utilize the full potential of the BI tool. This will maximize user adoption and minimize confusion.
-
Data governance: Establish clear data governance practices to ensure that the right users have access to the appropriate data. Regular audits and permission checks should be conducted to ensure compliance with internal policies and regulations.
-
Ongoing support and optimization: Implement an ongoing support system to help users troubleshoot issues. Regularly assess how the BI tool is being used and identify opportunities for optimization, such as adding new data sources or automating reports.
By considering these key elements and matching the tool to your organization’s specific needs, whether you’re a small business, medium enterprise, or large corporation, you can ensure that your BI platform will empower teams, streamline decision-making, and unlock valuable insights from your data.
Once chosen, proper implementation and training will ensure the tool becomes a key asset in your data-driven strategy.
How self-service BI is evolving towards agentic BI
While traditional self-service BI tools enable users to access, analyze, and visualize data, Agentic BI goes one step further by automating decision-making processes based on those insights.
This evolution integrates artificial intelligence (AI) and machine learning (ML) to make BI systems more proactive and responsive, reducing the reliance on human intervention for both analysis and decision execution.
This shift represents a significant transformation in how organizations interact with their data. Instead of merely serving as a tool for data reporting, Agentic BI tools act as autonomous decision-making assistants, providing users with the ability to automate actions directly from insights.
Let’s dive deeper into the key features of Agentic BI and explore how they are changing the BI landscape.
1. Self-driven actions
One of the most transformative features of Agentic BI is its ability to not only generate insights but also trigger actions automatically based on those insights.
This is a significant shift from traditional self-service BI tools, which primarily focus on presenting data and allowing users to interpret it.
With traditional BI tools, once insights are generated, it's up to the user to decide what action to take. This can result in delays, inconsistencies, and human error, especially in high-pressure, fast-moving environments where timely decisions are critical.
Agentic BI eliminates these bottlenecks by automating actions based on predefined rules or triggers.
|
For instance, an Agentic BI system could automatically trigger a marketing campaign if it detects a sudden rise in product interest, or it could notify the sales team to prioritize certain leads based on predictive analytics. These actions are not manually executed but are automatically initiated by the system, often in real-time. |
2. AI integration
AI and machine learning enable BI tools to go beyond simple data analysis by interpreting complex data, predicting future trends, and suggesting actionable steps.
By leveraging AI, Agentic BI tools can deliver predictive analytics that helps organizations foresee changes in customer behavior, market conditions, and business performance.
The integration of AI within BI tools makes it possible to uncover insights that would otherwise remain hidden.
AI-powered BI tools not only analyze historical data but also identify patterns, detect anomalies, and forecast future outcomes, which gives businesses a competitive edge in strategic planning and decision-making.
AI algorithms within Agentic BI tools analyze large datasets to identify trends or outliers that may signal a shift in the market.
|
For example, a retail business could use an AI-powered BI tool to analyze customer purchase patterns and predict future buying behavior. Based on these predictions, the system could suggest product promotions or even adjust stock levels in anticipation of demand surges. |
3. Human-machine collaboration
In traditional self-service BI, users must fully engage with the system to interpret data and make decisions. Agentic BI, however, shifts the role of the user from that of a hands-on analyst to more of an overseer of the process.
The system autonomously handles many of the routine tasks but still allows the user to provide final oversight and make higher-level decisions.
This transition from manual analysis to human-machine collaboration helps reduce the cognitive load on employees while still ensuring that decisions are informed and aligned with organizational goals.
By automating routine tasks and providing recommendations, Agentic BI allows employees to focus on strategic thinking and more complex problem-solving.
In this collaborative model, users still have the final say over certain processes, but much of the data analysis, reporting, and decision automation are handled by the system.
Users interact with the tool to guide its actions, adjust parameters, or review the results of automated actions, but they do not need to manually interpret or act on every data point.
AskEdgi and Agentic BI in action
AskEdgi by OvalEdge is a strong example of how Agentic BI is beginning to reshape the business intelligence landscape, bridging the gap between passive dashboards and interactive, governed decision-making support.
AskEdgi allows users to interact with their enterprise data using natural language queries, similar to asking a question in a search engine.
Instead of just returning static charts or reports, AskEdgi goes further by providing real-time, AI-driven recommendations and pre-configured actions, such as suggesting marketing campaigns, creating customer segments, or generating outreach messages based on the insights it uncovers.
|
For instance, a sales manager might ask, "Which region has the lowest sales this quarter?" AskEdgi not only returns the relevant insights but may also suggest actions such as targeting that region with specific offers or preparing a campaign plan. These actions can be captured in recipes, which are modular, reusable workflows that analysts or business users can run within governed environments. |
While AskEdgi does not currently perform outbound actions autonomously such as sending emails, triggering campaigns, or updating CRMs, it can prepare these actions by generating the necessary data outputs, recommendations, or target lists.
Operators or admins can then review and execute these recipes, ensuring that execution remains auditable, governed, and safe within enterprise environments.
AskEdgi also supports context persistence within threads and across sessions via pinned context and saved recipes.
While it does not offer long-term, adaptive memory that personalizes agent behavior over time, it does enable repeatable workflows by allowing users to return to previous threads, reuse recipes, and build on past interactions.
This makes it ideal for structured analytics tasks that require consistency and continuity, without introducing the risks of uncontrolled agent adaptation.
From a governance standpoint, AskEdgi is designed with enterprise controls in mind. All recipe executions, data enrichments, and query actions are subject to role-based access control (RBAC) and admin policies, ensuring that automation remains governed and bounded by organizational rules.
While AskEdgi supports automation via templates and rule-driven logic, all actions are subject to configuration and oversight, making it a responsible and scalable Agentic BI solution for modern data teams.
As AI continues to advance, tools like AskEdgi show how organizations can move beyond static reporting to enable collaborative, governed, semi-autonomous BI workflows, enhancing efficiency without compromising control.
Conclusion
Self-service BI tools are revolutionizing how teams interact with data by enabling them to independently manage data analysis, reporting, and visualization. This newfound autonomy eliminates the need for constant IT support, which has traditionally been required for report generation, data queries, and dashboard creation.
As a result, teams are empowered to access insights at their own pace, without waiting for IT departments to deliver reports or data insights. This shift significantly reduces common bottlenecks, such as long wait times for IT-generated reports, and accelerates decision-making processes.
Teams can make informed decisions in real-time, as they no longer have to rely on IT to provide the information they need when they need it.
-
How much valuable time is lost due to IT-driven report requests?
-
How often does traditional BI prevent teams from accessing data when needed most?
-
Is the reliance on IT for data analysis hindering organizational growth and innovation?
These questions highlight the fundamental issues with traditional BI systems that rely on IT teams for reporting and analysis. The time lost waiting for reports and the barriers to accessing data when it’s needed most can significantly impact an organization's agility.
Adopting self-service BI tools not only fosters a data-driven culture but also enhances efficiency, boosts productivity, and strengthens the overall decision-making process. Organizations that embrace these tools will be better positioned to adapt to changes, innovate, and maintain a competitive edge in the market.
Tired of slow, manual reporting?

With AskEdgi, access real-time data and automate actions instantly. Empower your team to act faster and make data-driven decisions without IT bottlenecks.

Try AskEdgi now and transform how you work with data.
FAQs
1. What is the difference between self-service BI and traditional BI?
Traditional BI often requires IT teams to manage data and generate reports, whereas self-service BI empowers business users to create their own reports and dashboards without needing technical expertise.
2. Do you need coding skills to use self-service BI tools?
Most self-service BI tools offer user-friendly, drag-and-drop interfaces that require no coding. However, some advanced features, such as SQL queries or custom formulas, may require basic technical knowledge.
3. Can self-service BI tools integrate with existing business systems?
Yes, most self-service BI tools can seamlessly integrate with various business systems like CRM, ERP, and cloud platforms, allowing organizations to unify data across multiple sources for comprehensive analysis.
4. How does self-service BI differ from Agentic BI?
While self-service BI allows users to explore data and generate insights, Agentic BI goes a step further by automating decision-making based on data insights, leveraging AI and machine learning for proactive actions.
5. Can self-service BI tools handle large data volumes?
Many self-service BI tools are scalable and can handle large datasets, particularly cloud-based platforms, ensuring businesses can continue to generate insights as their data grows in volume and complexity.
6. Can self-service BI tools automate report generation?
Yes, self-service BI tools allow users to automate the generation of reports, which can be scheduled to update periodically or triggered by specific events, saving time and improving efficiency.

.png?width=1081&height=173&name=Forrester%201%20(1).png)
.png?width=1081&height=241&name=KC%20-%20Logo%201%20(1).png)