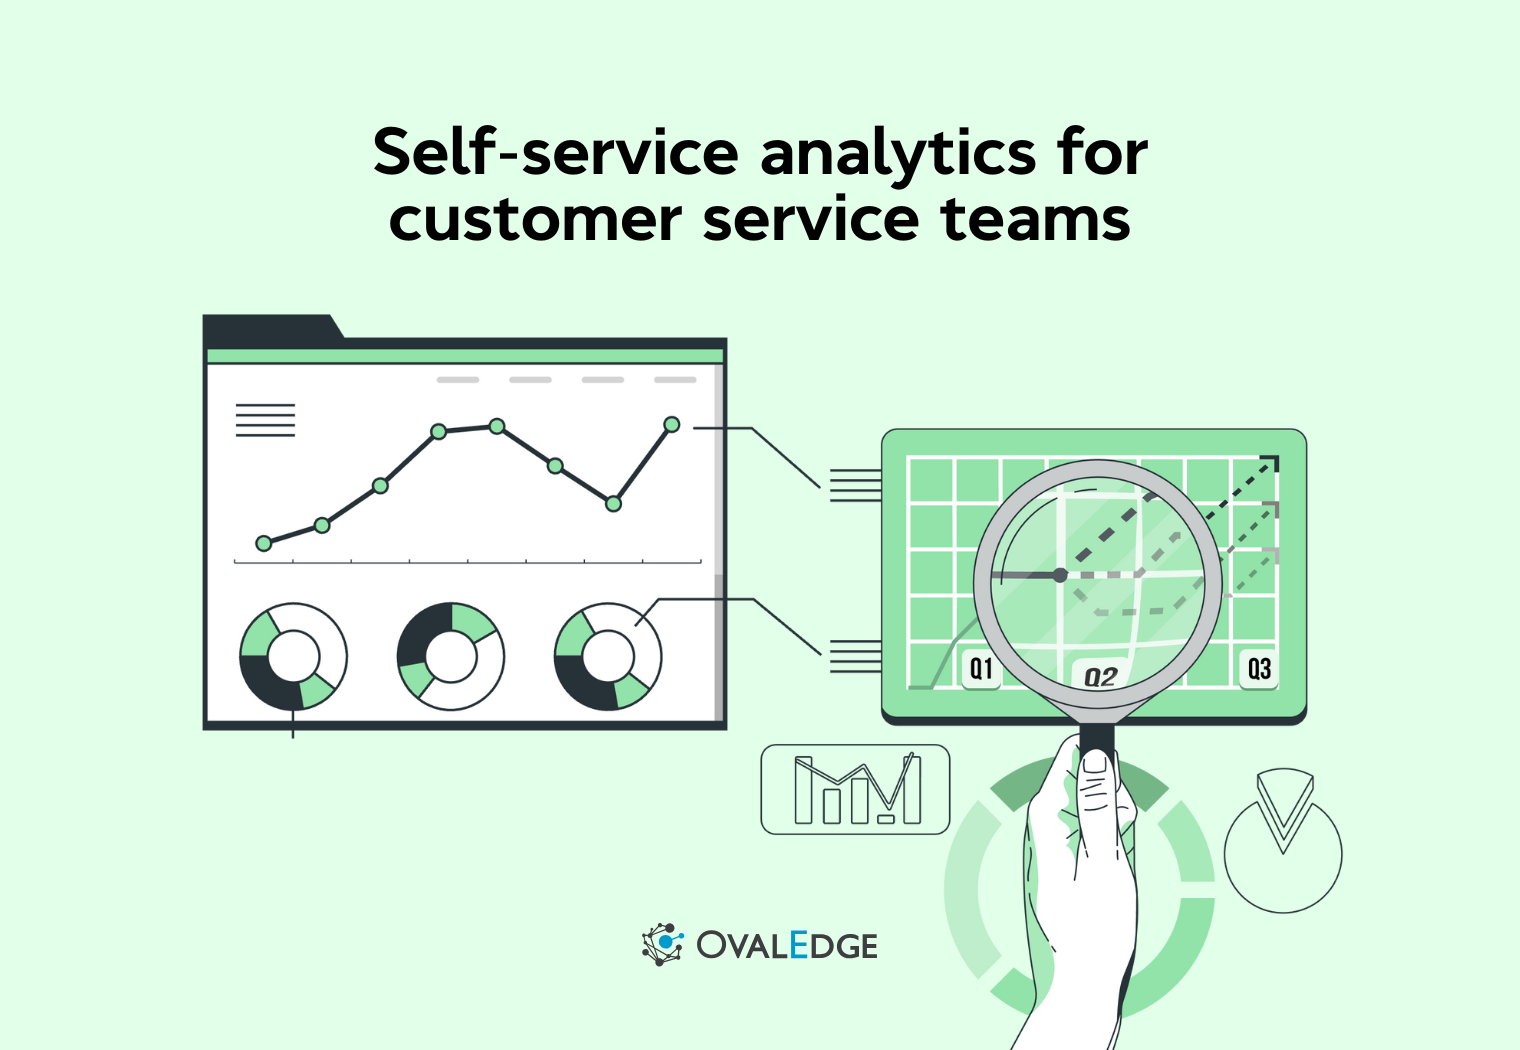
Self-service analytics for customer service enables support teams to analyse their own data without relying on analysts or IT. It gives managers and team leads real-time visibility into performance, helping them act faster on emerging issues. By using governed metrics and intuitive dashboards, teams reduce reporting delays and improve consistency. Over time, this leads to better response times, smoother operations, and more reliable customer service outcomes.
Customer service teams generate a constant stream of operational data. Ticket volumes, response times, resolution trends, and customer feedback all reflect how support is performing. Yet in many organisations, this data is slow to access and fragmented across systems. Managers wait for reports, rely on analysts for basic questions, or work from dashboards that reflect past conditions.
According to Salesforce’s State of Service report, service representatives spend only 46% of their time interacting with customers, with the rest consumed by internal processes and administration. When insights are delayed, these inefficiencies persist longer than they shoul.
Self-service analytics addresses this gap by giving support teams direct access to governed, decision-ready data. Managers and team leads can monitor performance as it unfolds and act earlier, without adding complexity or losing control.
This blog explores what self-service analytics for customer service really means, why it matters, and how teams can adopt it without adding complexity or losing control.
What is self-service analytics for customer service?
Self-service analytics for customer service allows support teams to access, analyse, and report on their own operational data without depending on analysts or IT. Instead of waiting for scheduled reports, teams work directly with governed data through intuitive dashboards.
In a customer service context, self-service analytics typically covers:
-
Ticket volumes and backlog trends
-
First response and resolution times
-
Customer satisfaction metrics such as CSAT and FCR
-
Agent performance and workload distribution
The emphasis is on usability. Data is already cleaned, modelled, and standardised, so teams focus on interpreting insights rather than preparing data.
Traditional reporting is often static and retrospective. Self-service analytics supports ongoing decision-making by enabling teams to:
-
Investigate issues as they occur
-
Compare performance across channels, regions, or time periods
-
Validate the impact of operational changes in near real time
At its core, self-service analytics gives support teams control over when and how they explore data, while governance ensures metrics remain consistent and secure.
Why self-service analytics matters in customer support
Customer support operates in fast, unpredictable cycles. Ticket volumes fluctuate, priorities shift, and small delays can quickly turn into SLA breaches. In this environment, slow or static reporting limits a team’s ability to respond.
Self-service analytics matters because it shortens the distance between what is happening and what teams can do about it.
From report-driven to decision-driven support operations
Traditional customer service reporting is built around periodic reviews. Metrics are analysed weekly or monthly, often after performance has already drifted. By the time insights surface, opportunities to intervene have passed.
Self-service analytics changes this operating model. Instead of waiting for reports, support teams work with live, governed metrics embedded into daily operations. Decisions about staffing, prioritisation, and escalation happen while conditions are changing, not after the fact. This shift, from analysing what happened to acting on what is happening, is what makes self-service analytics operationally meaningful in customer support environments.
That shift shows up in three practical ways:
1. Faster operational decisions
Managers and team leads can monitor ticket inflow, queue pressure, and SLA risk in near real time without waiting for scheduled reports. This allows teams to intervene early, adjusting staffing, rerouting tickets, or escalating issues, before problems cascade.
2. Reduced dependency on analysts and IT
Routine questions no longer require analyst support. Teams work with predefined metrics and trusted data models, reducing reporting backlogs and freeing analytics teams to focus on higher-impact initiatives rather than ad hoc requests.
3. Better execution at the team level
When everyone operates from the same dashboards and definitions, decisions stay aligned. Teams can rebalance workloads, validate process changes, and maintain service standards consistently across shifts, queues, and regions.
Core components of self-service analytics in customer service
For self-service analytics to work in customer service, a few foundational components must be in place. These ensure insights are usable, reliable, and relevant to day-to-day operations.
1. Unified and accessible customer data
Customer service data typically lives across ticketing systems, CRM platforms, chat tools, and call logs. Self-service analytics depends on connecting and standardising these sources so teams see a single, consistent view of support activity.
2. Simple, role-based dashboards
Dashboards should reflect how support teams work. Instead of complex reports, they focus on a small set of operational metrics such as ticket volume, response times, resolution rates, and customer satisfaction.
Well-designed dashboards:
-
Surface issues quickly through clear visuals
-
Show different views for agents, managers, and leaders
-
Avoid unnecessary metrics that distract from action
3. Self-serve exploration
Teams should be able to answer follow-up questions without technical help. This includes:
-
Filtering by time period, channel, or issue type
-
Comparing trends across teams or regions
-
Drilling into queues or categories when needed
4. Data governance and metric consistency
Self-service does not mean unmanaged data. Clear KPI definitions, consistent calculations, and role-based access ensure teams trust what they see and avoid conflicting reports. For customer service teams, governance matters because inconsistent metrics lead to inconsistent decisions across shifts, regions, and channels.
5. Timely insights and alerts
Near real-time data and automated alerts help teams respond quickly to ticket spikes, CSAT drops, or recurring issues before they escalate.
Together, these components make self-service analytics practical for everyday customer service decisions.
How self-service analytics workflows work
Self-service analytics works when data moves smoothly from support systems to decision-ready insights. The workflow behind it is designed to stay mostly invisible to end users while keeping outputs reliable.
1. Data preparation and governance
Data from ticketing tools, CRM systems, chat platforms, and feedback sources is cleaned and standardised before it reaches support teams. Categories are aligned, timestamps normalised, and duplicates removed.
At this stage:
-
KPIs are defined once and reused everywhere
-
Access rules are applied by role
-
Data quality checks prevent conflicting numbers
2. End-user interaction and visualisation
Support teams interact only with prepared data. Dashboards and reports allow users to explore trends without handling raw data.
Typical actions include:
-
Filtering by time, channel, or issue type
-
Comparing performance across teams or regions
-
Drilling into queues to understand root causes
Clear visualisation helps teams spot patterns quickly without analytical complexity.
3. From observation to action
Insights become valuable only when they inform decisions. A rise in ticket volume may point to a product issue. A dip in CSAT may align with longer resolution times. Self-service analytics shortens this loop by keeping insights current and accessible.
This workflow ensures teams spend time acting on insights, not chasing data.
Best practices for implementing self-service analytics in customer service
Self-service analytics delivers value only when it is implemented with intention. Without a clear structure, it can quickly turn into fragmented dashboards and conflicting metrics.
Establish governance and standards
Define core KPIs, metric definitions, and ownership upfront. Support teams need confidence that numbers are accurate and consistent across dashboards. Lightweight audits and documented definitions help maintain trust in insights over time.
Grow data literacy across teams
Tools alone are not enough. Support managers and team leads need basic data literacy to interpret trends correctly. Short training sessions, shared templates, and real examples help teams move from viewing dashboards to using insights effectively.
Build for scalability and performance
Customer service data grows quickly, especially in high-volume environments. The underlying analytics stack must handle peak usage without lag. Performance issues erode trust and push teams back to manual reporting.
Customer service analytics tools that support self-service
Below is a practical view of tools commonly used to enable self-service analytics in customer service. The intent here is not to rank tools, but to show how different platforms support different levels of maturity and control.
Top-rated tools for reporting and dashboards
-
Looker
Looker is used by teams that need consistent, self-service reporting at scale. For customer service, it helps managers explore performance data using shared metrics rather than ad hoc reports. Its centralised definitions reduce confusion as more teams rely on analytics for day-to-day decisions.
-
Tableau
Tableau is commonly used for interactive dashboards and visual exploration. Customer service teams use it to analyse ticket trends, SLA adherence, and agent performance through filters and drill-downs. Its strength lies in flexible visualisation, though it typically relies on strong data preparation and governance outside the tool.
-
Microsoft Power BI
Microsoft Power BI is widely adopted in organisations already using the Microsoft ecosystem. It supports role-based dashboards and scheduled refreshes for standard customer service reporting. Its effectiveness depends on how well data models and definitions are maintained upstream.
Features to look for in analytics platforms
-
Ease of use for support teams: The platform should be intuitive for managers and team leads, allowing them to explore data and answer routine questions without technical training or analyst support.
-
Timely access to operational data: Customer service decisions rely on current information. Analytics should reflect near real-time conditions, with clear visibility into when data was last updated.
-
Built-in governance and consistency: Self-service requires trust in the numbers. Standardised KPI definitions, consistent calculations, and role-based access ensure teams work from the same source of truth.
-
Flexible self-serve exploration: Teams should be able to filter, compare, and drill into data by channel, issue type, or time period to investigate follow-up questions on their own.
-
Collaboration and actionability: Insights should be easy to share and discuss. Features such as shared dashboards or annotations help teams align and act on findings quickly.
Tool selection checklist for support teams
Use the questions below to assess whether an analytics platform truly supports self-service in a customer service environment.
-
Can support teams use this without technical help?
The platform should work for managers and team leads without SQL, complex setup, or constant analyst involvement. If basic questions need support, it is not truly self-service.
-
Does it reflect real customer service workflows?
Dashboards and metrics should map to how support teams operate day to day, including queues, channels, shifts, and issue types.
-
Is the data consistent and clearly defined?
Teams should be able to understand how metrics are calculated and trust that the same numbers appear across dashboards and reports.
-
Does it integrate cleanly with existing systems?
The tool must connect reliably with helpdesk platforms, CRM systems, and feedback tools to avoid fragmented or partial views of performance.
-
Will it scale as volumes and usage grow?
Performance should remain stable during peak support hours, even as ticket volumes, users, and data complexity increase.
-
Does it meet security and compliance needs?
Role-based access, auditability, and alignment with data privacy regulations such as GDPR and CCPA are essential for customer service data.
Measuring the impact of self-service analytics
The success of self-service analytics should be evaluated based on outcomes, not dashboard usage. Impact shows up in both operational efficiency and service quality.
-
Reduction in reporting effort: One of the first signals of impact is less time spent creating and requesting reports. When managers can access insights independently, reporting cycles shorten, and analyst dependency decreases.
-
Faster operational response: Teams should be able to identify backlogs, SLA risks, or volume spikes earlier and respond sooner. This is reflected in quicker adjustments to staffing, prioritisation, and queue management.
-
Improved consistency in performance: With shared metrics and dashboards, performance tracking becomes more uniform across teams, shifts, and regions. Variability caused by reporting gaps or delayed insights reduces over time.
-
Customer experience improvements: Although customers never interact with analytics directly, earlier interventions lead to faster responses and fewer escalations. Improvements in CSAT, FCR, and repeat contact rates indicate analytics is influencing outcomes.
Tracking these indicators helps teams assess whether self-service analytics is improving how customer service operates, not just how data is accessed.
Conclusion
Self-service analytics helps customer service teams make faster, more informed decisions without relying on delayed reports or constant analyst support. When teams can access the right data at the right time, operational issues are identified earlier and handled more consistently.
The long-term impact depends on strong foundations. Clear metrics, shared definitions, and reliable data workflows ensure self-service analytics remains useful as adoption grows.
Platforms like OvalEdge support this by helping teams maintain trust and consistency in customer service metrics.

For customer service teams, self-service analytics is a practical way to improve performance without adding operational overhead.
FAQs
1. What is self-service analytics for customer service?
Self-service analytics for customer service allows support teams to access, explore, and report on their own performance data without relying on analysts or IT. It helps teams monitor metrics such as response times, ticket volumes, and customer satisfaction using governed, easy-to-use dashboards.
2. Who uses self-service analytics in customer service teams?
Self-service analytics is used by support managers, team leads, operations leaders, and, in some cases, senior agents. Customers do not use analytics. It is an internal capability designed to improve service operations and decision-making.
3. How does self-service analytics improve customer service performance?
By providing timely visibility into operational data, teams can identify issues earlier, rebalance workloads, and address recurring problems before they escalate. This leads to faster responses, more consistent resolution times, and better customer satisfaction.
4. What metrics are most important for self-service customer service analytics?
Commonly tracked metrics include first response time, average resolution time, ticket backlog, CSAT, First Contact Resolution, escalation rates, and agent productivity measures. The focus should be on metrics that directly support action.
5. Do support teams need technical skills to use self-service analytics?
Most modern self-service analytics platforms are designed for non-technical users. While no advanced technical skills are required, basic data literacy helps teams interpret trends and make better decisions.
6. How can organisations maintain data trust as self-service analytics scales?
Data trust is maintained through clear metric definitions, role-based access controls, and consistent governance. Platforms such as OvalEdge support this by helping teams understand data sources and definitions as analytics usage expands.


.png?width=1081&height=173&name=Forrester%201%20(1).png)
.png?width=1081&height=241&name=KC%20-%20Logo%201%20(1).png)