Many organizations collect vast amounts of data but struggle to turn it into meaningful decisions. Business Intelligence (BI) brings structure by analyzing historical and real-time data to show what happened and why. Data Analytics complements this by uncovering patterns, predicting future behavior, and guiding strategic optimization. When combined, BI and Data Analytics help businesses move beyond reporting toward proactive decision-making, enabling teams to respond to current performance while preparing for what comes next.
In the age of data overload, businesses are often left in the dark about how to use the very information they’re collecting. 72% of business leaders admit that the overwhelming amount of data and their lack of trust in it has caused them to make no decisions at all.
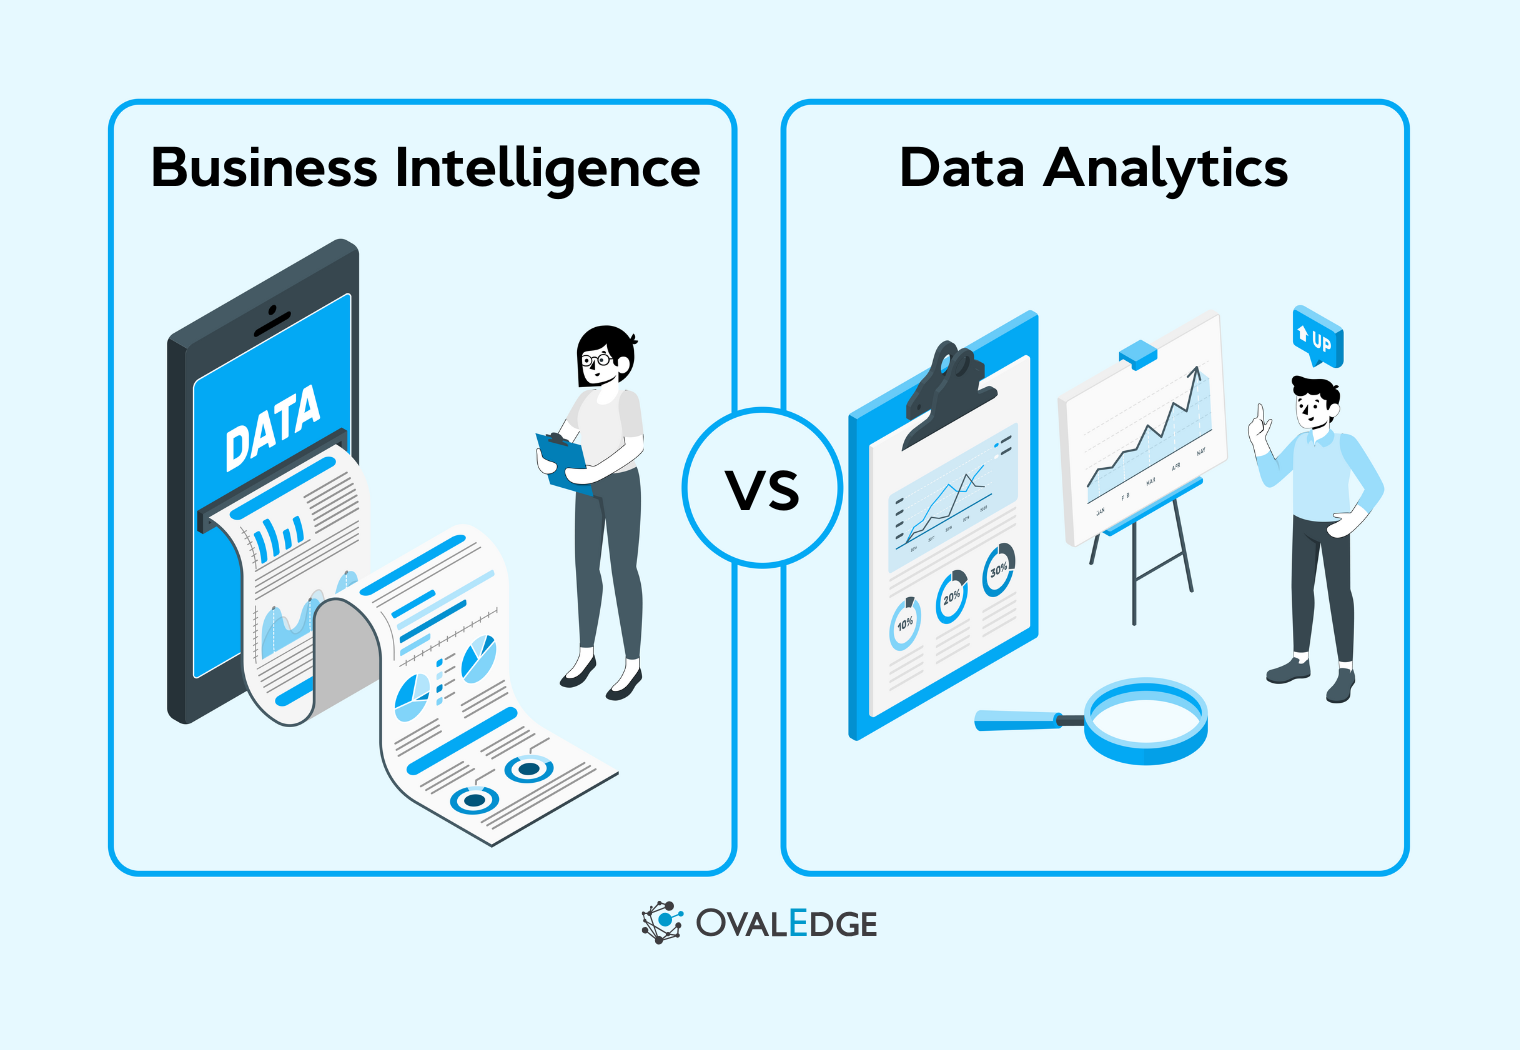
This confusion is even more pronounced when it comes to Business Intelligence (BI) and Data Analytics, two terms that many assume are interchangeable, but are actually distinct and serve very different purposes.
BI helps businesses understand what happened in the past and why, while Data Analytics is about predicting what will happen in the future and optimizing strategies accordingly.
In this blog, we’ll unravel the differences between BI and Data Analytics, showing how they can work in tandem to give your business the clarity and foresight needed to thrive in today’s data-driven world.
How business intelligence and data analytics work
To unlock the full potential of data, it's important to understand how Business Intelligence (BI) and Data Analytics complement each other. These two fields work together to help businesses make smarter decisions, but each brings something unique to the table. Let’s break down how they work and why both are essential.
Business intelligence: turning past data into actionable insights
Business Intelligence (BI) is all about understanding what happened in your business and why. It focuses on the past and the present, helping organizations monitor their performance and make sense of historical data.
-
Purpose: BI transforms historical and current data into visual reports, dashboards, and key performance indicators (KPIs).
-
Techniques: It relies heavily on data visualization, querying, and reporting tools like Tableau, Power BI, and Looker to monitor trends, patterns, and overall performance.
-
Outcome: It provides businesses with a clear picture of their current status, sales figures, website traffic, and employee performance, enabling informed decision-making.
|
For example, a retail company might use BI to analyze past sales data, monitor inventory levels, and track customer satisfaction. This helps the business assess what’s working well and where improvements are needed. |
Data Analytics: Predicting the future to drive strategy
While BI looks backward, Data Analytics focuses forward. It’s about answering what will happen next and optimizing business strategies for future success.
-
Purpose: Data Analytics uses predictive models and statistical techniques to analyze data and forecast future outcomes.
-
Techniques: It involves advanced methods like predictive analytics, data modeling, and machine learning. Tools such as Python, R, SAS, and SQL help organizations dive deeper into the data and uncover hidden patterns.
-
Outcome: With Data Analytics, businesses can anticipate changes in customer behavior, forecast demand, optimize marketing strategies, and even prevent future risks.
|
For instance, a marketing team might use Data Analytics to predict which customers are most likely to make a purchase, optimizing their campaigns to target those individuals with personalized offers. |
Bringing it together: BI + Analytics for smarter decisions
While Business Intelligence and Data Analytics have distinct roles, they complement each other perfectly. BI gives you the insight into what’s happened, while Data Analytics helps you predict what’s coming next.
-
BI provides a clear view of current performance and past trends, helping businesses make decisions based on facts.
-
Analytics, on the other hand, leverages historical data and predictive models to help businesses adapt and prepare for the future.
By using both together, businesses can not only react to what’s happening now but also proactively adjust their strategies to stay ahead of the curve.
|
Pro Tip: One of the key challenges organizations face when implementing both BI and Data Analytics is managing data quality and access. Without proper governance, data can become fragmented, inaccurate, or difficult to access, which undermines the effectiveness of both BI and Analytics. The Implementing Data Access Governance Whitepaper from OvalEdge provides a proven framework for overcoming these challenges by ensuring that the right people have access to the right data at the right time. |
Key differences between business intelligence and data analytics
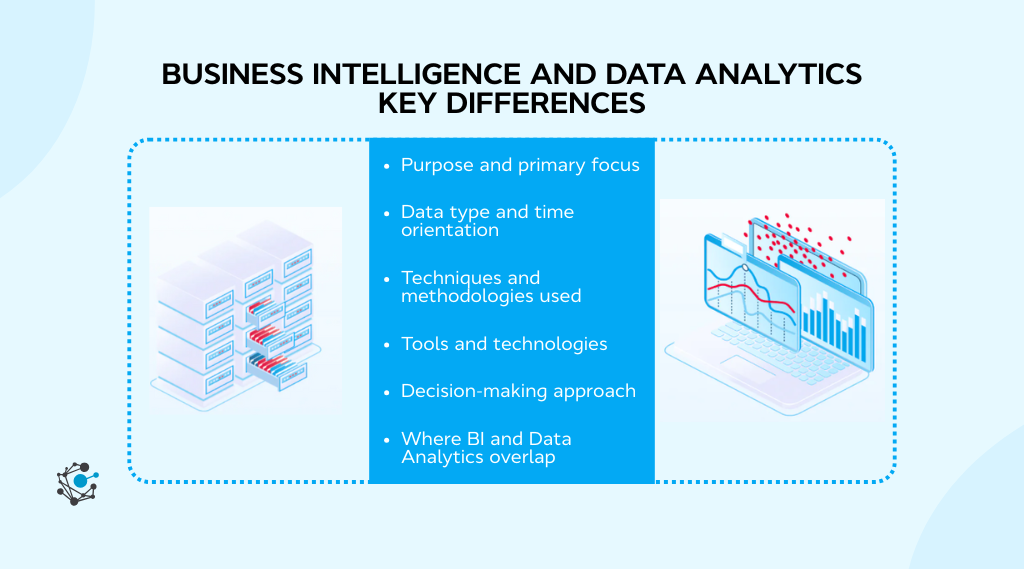
While Business Intelligence and Data Analytics are often used together, their purposes, techniques, and applications are quite different. Let’s break down these differences to clarify how each plays its own vital role in driving business decisions.
|
Aspect |
Business Intelligence (BI) |
Data Analytics |
|
Purpose and Primary Focus |
Monitors past performance and answers what happened and why. |
Forecasts future outcomes and provides what will happen and how. |
|
Data Type and Time Orientation |
Primarily uses structured, historical data focused on past and current performance. |
Uses both structured and unstructured data, including real-time data, focused on predictive and future outcomes. |
|
Techniques and Methodologies |
Data visualization, OLAP, querying, and reporting for trend analysis. |
Predictive modeling, machine learning, statistical analysis, and data mining for trend prediction and optimization. |
|
Tools and Technologies |
BI tools like Power BI, Tableau, Looker, and Google Data Studio for visual reports and dashboards. |
Analytics tools like Python, R, SAS, SQL, Spark, and Hadoop for modeling and predictive analytics. |
|
Decision-Making Approach |
Focuses on what happened and supports operational decision-making (e.g., performance tracking). |
Focuses on what will happen and supports strategic decision-making (e.g., forecasting and optimization). |
|
Where They Overlap |
BI tracks current trends and historical data to make informed operational decisions. |
Analytics uses BI insights to predict future trends and optimize strategies, creating a holistic, data-driven approach. |
Why do these differences matter? practical applications
Understanding the distinctions between Business Intelligence (BI) and Data Analytics is crucial because it shapes how businesses apply them in real-world scenarios. Rather than seeing these approaches as competing, it’s important to recognize that they complement each other and drive smarter, data-driven decisions when used together.
For a business to get the most out of both BI and Data Analytics, having a solid data governance framework in place is essential.
A practical guide for implementing data governance, like the Implement Data Governance: Best Practices Whitepaper from OvalEdge, can help you establish the data readiness required for both BI and Analytics initiatives.
It ensures data quality, accuracy, and accessibility, which are critical for making informed decisions in both real-time and predictive analytics.
Let’s explore how BI and Data Analytics work together in practice.
Business reporting and dashboards (BI use case)
Business Intelligence plays a key role in helping businesses track performance and monitor progress through data visualizations, dashboards, and reports.
-
BI in action: A retail business might use Power BI or Tableau to create a dashboard that tracks daily sales, inventory levels, and customer satisfaction scores. This helps the team monitor real-time performance and make quick adjustments where necessary.
-
Complementary role: While BI helps track the present, Data Analytics can take this data and predict future trends, such as sales forecasts based on historical performance. For example, predictive analytics might highlight a seasonal sales spike, allowing the business to plan stock accordingly.
|
Why it matters: By combining BI’s real-time reporting with Analytics’ ability to predict, businesses can stay ahead of the curve, making data-driven decisions that are informed by both the present and the future. |
Predictive modeling and forecasting (analytics use case)
While BI is about understanding what happened, Data Analytics is all about looking ahead. Using predictive modeling and statistical analysis, businesses can forecast future trends, customer behavior, and market conditions.
-
Analytics in action: A marketing team might use predictive analytics to forecast customer lifetime value (CLV) based on factors like past purchases, engagement, and browsing history. With this, the team can predict which customers are most likely to convert, leading to more efficient marketing spend.
-
Complementary role: BI tools will help track the current customer behavior and monitor engagement levels, while Data Analytics will predict which customer segments are likely to respond to targeted campaigns. Together, they can refine strategies and improve ROI.
|
Why it matters: Data Analytics helps anticipate future business needs and optimize strategies, while BI ensures that businesses have accurate and current data to make real-time decisions. |
Data-driven strategy and optimization
When used together, BI and Data Analytics help create data-driven strategies that optimize both day-to-day operations and long-term planning.
-
BI in action: A logistics company might use BI to track delivery times, route efficiency, and fleet performance. By monitoring daily operations, the company can make quick adjustments to optimize logistics.
-
Analytics in action: Meanwhile, Data Analytics could predict the most efficient delivery routes based on weather patterns, traffic data, and historical delays, enabling the company to make strategic adjustments and optimize resources for future growth.
|
Why it matters: By combining the real-time insights from BI with the future-focused predictions from Analytics, businesses can optimize their operations and strategies simultaneously, ensuring they’re performing well now while preparing for future challenges. |
Leveraging both for business agility
The key to business agility lies in the combination of business intelligence and Data Analytics. BI allows businesses to react quickly to immediate needs, while Data Analytics helps them anticipate changes and opportunities, ensuring they’re always one step ahead.
-
BI + Analytics in action: A customer support team might use BI to analyze real-time customer feedback and ticket volumes, while using Analytics to forecast customer satisfaction trends and optimize staffing accordingly.
|
Why it matters: Together, these two approaches give businesses the ability to respond to challenges while also planning for future success. |
How to choose between BI and Data Analytics for your business
Choosing between Business Intelligence (BI) and Data Analytics can be a challenge, especially since both offer valuable insights. The right choice depends on your business’s current needs, data maturity, goals, and resources. Let's break it down into actionable steps that will help guide your decision.
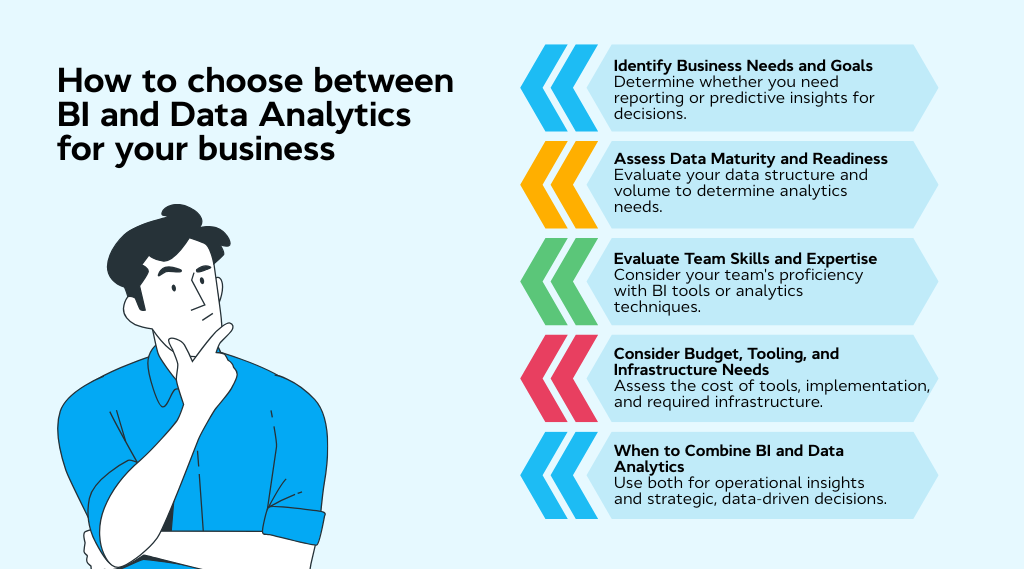
1. Identify your business needs and goals
Before deciding between BI and Data Analytics, it’s crucial to understand your primary goals and what you need to achieve with your data.
-
Use BI if: You need to monitor your current performance, track operational metrics, and make real-time decisions based on historical data.
-
Use Data Analytics if: Your focus is on predicting future outcomes, optimizing strategies, and forecasting trends for long-term decision-making.
|
Example: If you're looking to track sales performance and monitor customer satisfaction, BI is the way to go. But if you're trying to predict customer churn or sales trends, Data Analytics would be the better option. |
2. Assess data maturity and readiness
The level of maturity in your data infrastructure plays a big role in determining which approach is best suited for your organization.
-
Use BI if: Your data is already well-organized and structured, and you need an intuitive way to visualize and report on it.
-
Use Data Analytics if: Your data is vast, unstructured, or not yet fully optimized for predictive analysis. Analytics often requires more complex data preparation and modeling.
|
Example: If you have a robust data warehouse with clearly structured data, BI will work well for you. But if your organization is just starting to explore predictive models, Data Analytics may require an investment in data cleansing and preprocessing first. |
3. Evaluate team skills and expertise
Your team’s familiarity with the tools and techniques required for either approach will influence your decision. Both BI and Data Analytics often require different skill sets.
-
Use BI if: Your team has experience with data visualization tools, such as Power BI, Tableau, or Looker. These tools are user-friendly and designed for business analysts who need actionable insights with minimal technical expertise.
-
Use Data Analytics if: Your team includes data scientists or analysts who are comfortable working with advanced statistical models, machine learning frameworks, and tools like Python, R, or SAS.
|
Example: If your team is skilled at creating dashboards and reports, BI will be a natural fit. But if you have data scientists who can build predictive models, Data Analytics will provide more value. |
4. Consider budget, tooling, and infrastructure Needs
The cost of implementing and maintaining BI and Data Analytics solutions varies depending on the complexity of the tools and the size of the data being processed.
-
Use BI if: You need affordable, scalable solutions that are easy to set up and use, with a focus on operational efficiency.
-
Use Data Analytics if: You have a larger budget and are ready to invest in more complex infrastructure, including machine learning models, high-powered analytics tools, and possibly cloud services for processing big data.
|
Example: If you’re a small business with limited resources, BI tools like Google Data Studio or Tableau may be more suitable. Larger companies with bigger datasets and more complex forecasting needs may need Data Analytics platforms like SAS or Azure Machine Learning. |
5. When to combine BI and Data Analytics
You don’t always have to choose one over the other. In fact, combining BI and Data Analytics can help you get the best of both worlds.
-
Use both BI and Analytics if: You want to use BI for real-time operational insights (e.g., sales, inventory, and customer satisfaction) and Analytics for predictive modeling (e.g., forecasting demand, customer behavior prediction).
|
Example: A retail business might use BI to track daily sales performance, while using Data Analytics to predict upcoming demand spikes and adjust inventory accordingly. |
Conclusion
In a world driven by data, it’s crucial to understand the value of Business Intelligence (BI) and Data Analytics. BI excels in providing clarity on past performance, while Analytics allows you to forecast future outcomes.
The key is recognizing how each fits into your strategy, such as BI for real-time insights and Analytics for future-focused decisions. By combining both, businesses can unlock deeper insights, adapt quickly, and stay ahead of the competition.
When used together, BI provides the foundation of accurate, historical data, while Data Analytics builds on it to offer actionable predictions and optimization strategies. This combination creates a powerful framework for making informed decisions that drive growth and efficiency.
Whether you’re leveraging predictive modeling to optimize marketing strategies or using real-time dashboards to monitor day-to-day operations, integrating both will give you the edge in today’s competitive business landscape.
By combining these approaches, you can make smarter, faster, and more effective decisions for both the present and the future.
FAQs
1. Can Business Intelligence be used without Data Analytics?
Yes, businesses can use Business Intelligence (BI) for basic reporting, performance monitoring, and historical data analysis. However, without Data Analytics, you miss out on predictive insights that help with future forecasting and optimizing strategies.
2. How does Business Intelligence help businesses stay agile?
BI supports agility by offering real-time dashboards and performance tracking. This enables businesses to quickly respond to changes, track KPIs, and make timely adjustments to optimize operations and achieve business goals.
3. Is Data Analytics only for large organizations, or can small businesses benefit too?
Data Analytics isn’t just for large organizations. Small businesses can benefit significantly from predictive analytics to forecast customer behavior, optimize inventory, and make data-driven decisions that improve efficiency and competitiveness.
4. Can Data Analytics predict human behavior or is it limited to numbers?
Yes, Data Analytics can predict human behavior by analyzing patterns in customer data such as purchase history, browsing activity, and social media engagement. This allows businesses to forecast actions and tailor marketing strategies accordingly.
5. How often should businesses update their Business Intelligence tools?
It’s important to update BI tools regularly to incorporate new data sources, improve functionality, and adapt to evolving business needs. Typically, updates should be made on an annual or quarterly basis, depending on the rate of change in data and business objectives.
6. Do companies need separate teams for BI and Data Analytics?
Not necessarily. While BI teams focus on reporting and monitoring, and Data Analytics teams handle more advanced techniques like predictive modeling and machine learning, some organizations combine both roles to foster collaboration and streamline decision-making.

.png?width=1081&height=173&name=Forrester%201%20(1).png)
.png?width=1081&height=241&name=KC%20-%20Logo%201%20(1).png)