Business context in enterprise analytics determines how accurately teams interpret data and make decisions. Without it, the same metric can lead to conflicting conclusions, delayed actions, or incorrect responses. This guide explains what business context is, how it improves analytics interpretation, and why it directly impacts decision quality. It also covers real-world examples, common pitfalls, and practical steps organizations can take to build context-aware analytics that support faster, more aligned, and outcome-driven decision-making.
Organizations rely heavily on dashboards, reports, and recurring reviews to understand business performance. However, numbers alone do not always provide clarity. The same metric can be interpreted differently across teams, leading to misalignment and inconsistent decisions.
This is where the importance of business context in enterprise analytics becomes critical. It is not about generating more data or building additional reports, but about ensuring that metrics are understood within the right business context.
In this guide, we examine how business context shapes analytics interpretation, influences decision-making, and helps teams use data more effectively to drive aligned and actionable outcomes.
What is business context in enterprise analytics?
Business context in enterprise analytics connects data to business meaning by linking metrics with goals, definitions, workflows, and real-world conditions. It helps teams interpret insights accurately, not just read numbers.
It brings consistency to how metrics are understood across teams, reduces ambiguity in dashboards, and improves trust in data. More importantly, it enables teams to move from observing changes to understanding what they mean and how to respond.
Without this layer, analytics can lead to incomplete or incorrect conclusions. With it, insights become clearer, more actionable, and aligned with actual business outcomes.
Key elements that give analytics business meaning
When teams rely on context-aware business intelligence, they move beyond surface-level reporting and start interpreting data in a way that reflects actual business conditions. Analytics becomes meaningful when it answers not just what changed, but why it changed.
Some of the key elements that bring this meaning into analytics include:
-
Business goals and KPIs: Metrics gain relevance only when tied to outcomes like revenue growth, retention, or operational efficiency. Without this link, numbers remain disconnected from impact.
-
Operational conditions and workflows: Changes in processes, delays, or dependencies often explain performance shifts better than the numbers themselves.
-
Metric definitions and calculation logic: When teams use different formulas for the same KPI, it creates confusion and inconsistent reporting.
-
Stakeholder roles and decision context: Finance, marketing, and operations interpret the same data differently based on their objectives and responsibilities.
-
External influences: Market trends, seasonality, pricing changes, or supply issues can significantly affect metrics and must be considered during interpretation.
These elements together form the foundation of enterprise analytics best practices, ensuring that insights are both accurate and relevant.
|
Did you know? According to the 2024 CDO Agenda Survey, 46% of data leaders say data quality and identifying the right use cases are the biggest barriers, and only 37% believe they have the right data foundation. This shows that analytics struggles not due to a lack of data, but a lack of well-contextualized data. |
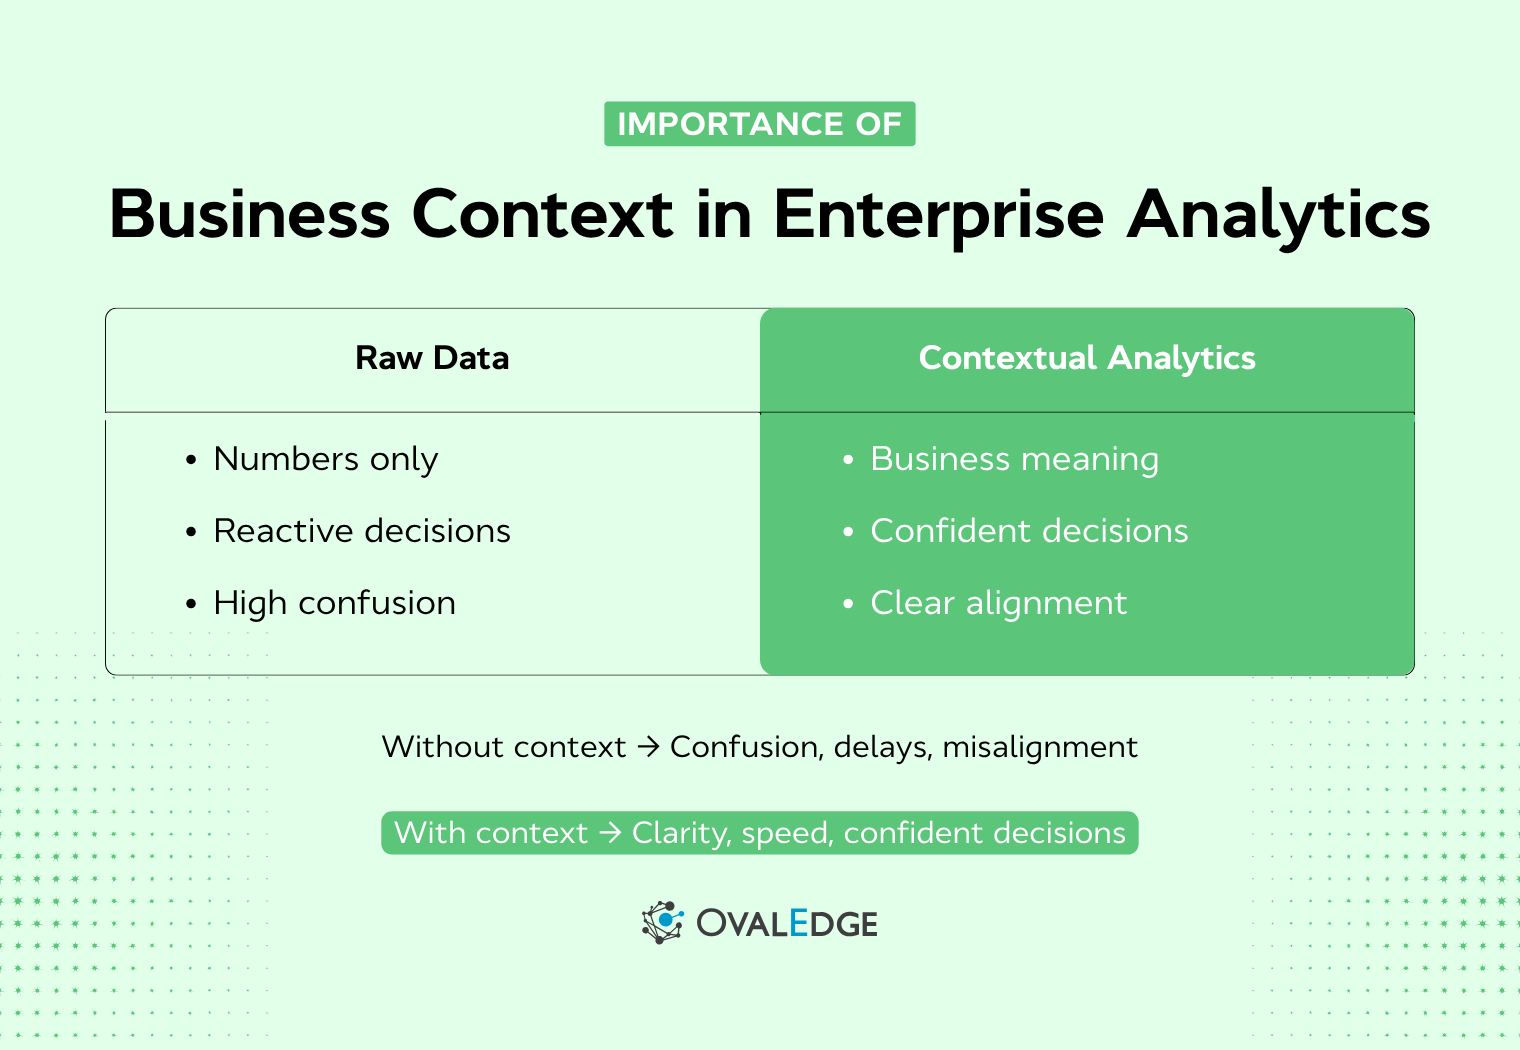
Business context vs raw data interpretation
The difference between reading data with and without context often determines the quality of decisions that follow. Here’s a simple comparison:
|
Aspect |
Raw data interpretation |
Contextual analytics enterprise |
|
Interpretation quality |
Focuses only on numbers |
Connects numbers to business reality |
|
Decision confidence |
Often debated across teams |
More aligned and confident decisions |
|
Business relevance |
Limited to reporting |
Directly tied to business outcomes |
|
Risk of misinterpretation |
High |
Significantly reduced |
|
Actionability |
Reactive responses |
Clear, structured actions |
For example, a drop in conversion rate might immediately trigger concern. But when viewed through a contextual analytics enterprise, that same drop could be explained by a recent pricing update or a shift in the target audience.
This is why the importance of business context in enterprise analytics goes beyond reporting accuracy and data governance. It directly shapes how teams interpret insights and decide what to do next.
How business context improves analytics interpretation and decision-making
When we look at analytics in isolation, we often get partial answers. But when we layer in context, the same data starts telling a clearer, more actionable story. This is where contextual analytics enterprise shifts from reporting to real decision support. It connects numbers to meaning, and meaning to action.
Why dashboards without context lead to weak decisions
Most dashboards are designed to show changes in performance, such as revenue drops, churn increases, or conversion declines. However, they rarely explain the underlying drivers behind those changes.
When context is missing, teams tend to:
-
React quickly without full understanding
-
Interpret the same metric differently across functions
-
Assume root causes instead of validating them
For example, a revenue dip may trigger increased sales or marketing efforts, when the actual issue could be external factors such as supply constraints or seasonal demand shifts.
This is why data-driven decision making is critical. Without it, dashboards highlight signals but fail to guide decisions.
|
Did you know? The same 2024 CDO study found that 70% of organizations struggle with behavior change, 59% lack a data-driven culture, and 50% face data literacy gaps, highlighting that interpretation, not access, is the bigger challenge. |
How context changes the meaning of the same metric
Business context directly affects how metrics are interpreted. The same number can indicate very different realities depending on surrounding conditions.
For example:
-
A revenue decline during a seasonal slowdown may be expected rather than a performance issue
-
A churn increase after a pricing change may reflect a short-term adjustment rather than a long-term risk
-
A drop in campaign performance may result from audience shifts, not execution quality
In each case, the metric itself remains unchanged, but the interpretation shifts based on context. This prevents incorrect conclusions and helps teams focus on actual drivers rather than surface-level signals.
How context turns analysis into action
The value of analytics is realized only when it leads to clear and aligned action. Business context enables this by linking metrics to causes and decision pathways.
A typical flow becomes:
-
Metric: A change is observed
-
Insight: The underlying cause is identified
-
Decision: Teams align on interpretation
-
Action: Targeted steps are executed
Without context, this flow breaks at the interpretation stage. With context, teams can prioritize effectively, act with confidence, and focus on outcomes that align with business goals.
This is what separates analytics that informs from analytics that drives execution.
|
Did you know? According to the IBM 2025 CEO Study, 65% of CEOs prioritize AI use cases based on ROI, but only 52% say these investments deliver value beyond cost reduction, showing a gap between analysis and real business impact. |
Why business context matters for enterprise analytics outcomes
The value of analytics is not in reporting numbers, but in driving decisions. The importance of business context in enterprise analytics lies in making those decisions more accurate, aligned, and actionable.
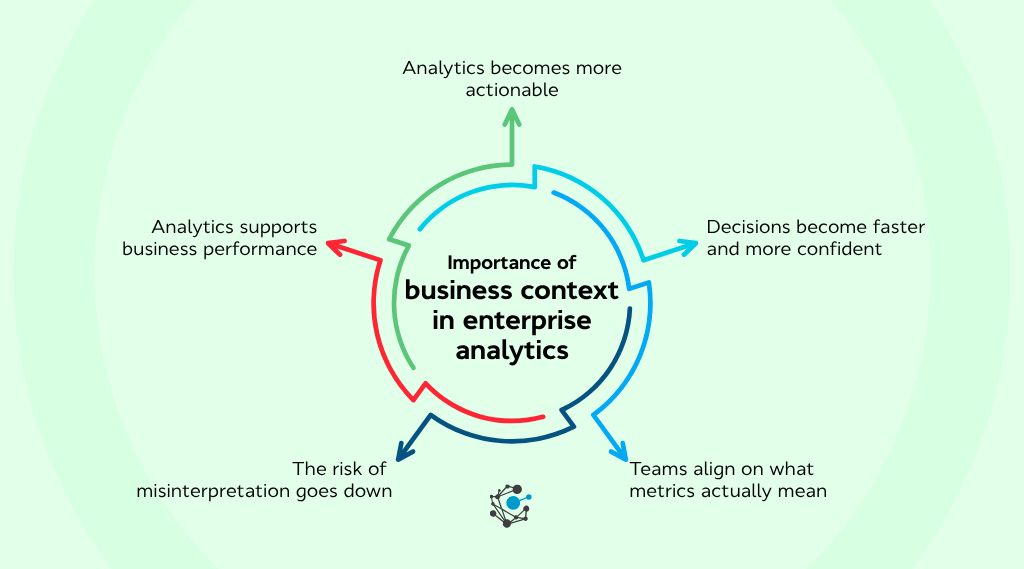
Here’s how business context directly improves analytics outcomes:
-
Analytics becomes more actionable: Instead of just highlighting what changed, it explains why it changed and what needs to happen next.
-
Decisions become faster and more confident: Teams spend less time debating interpretations and more time acting on aligned insights.
-
Teams align on what metrics actually mean: Shared definitions and context reduce conflicts between departments like finance, sales, and marketing.
-
Risk of misinterpretation goes down: Context helps avoid overreactions or incorrect conclusions based on incomplete information.
-
Analytics supports business performance, not just reporting: Insights become tied to real outcomes like revenue growth, customer retention, or operational efficiency.
For example, a churn increase without context may trigger broad retention efforts. With context, teams may identify that it is limited to a specific segment or tied to a planned change.
| Did you know?
The Deloitte 2025 Digital & Data Analytics Survey reports that 90% of teams have analytics aligned with business strategy, yet still face barriers like poor data quality and limited access, reinforcing that alignment alone does not guarantee usable insights. |
This shift from reaction to precision is why context-aware business intelligence improves analytics outcomes.
Real-world examples of context-driven analytics in enterprises
This is where the importance of business context in enterprise analytics becomes tangible. The same metric can lead to very different decisions depending on whether context is applied or not. The examples below show how interpretation changes when analytics is connected to business reality.
1. Sales and revenue analytics
A revenue decline is often treated as a performance issue. Teams may push for more pipeline generation or increase sales pressure. But without context, this can lead to the wrong response.
-
Metric observed: Monthly revenue drops
-
Missing context: Demand slowdown due to seasonal buying patterns
-
Likely wrong interpretation: Sales team underperformance
-
Better conclusion with context: Revenue decline is expected for the period
In another case, a slowdown in sales might not be demand-related at all. It could be tied to inventory shortages or fulfillment delays, which limit the ability to close deals.
With context-aware business intelligence, teams avoid overcorrecting and instead focus on the actual constraint affecting performance.
2. Marketing and customer analytics
Marketing metrics often shift quickly, and without context, they can be misread as campaign failures.
-
Metric observed: Drop in conversion rates
-
Missing context: Recent change in audience targeting or channel mix
-
Likely wrong interpretation: Campaign underperformance
-
Better conclusion with context: Shift in audience quality or intent
Churn is another common example. A spike in churn might trigger immediate concern, but context often reveals that it is linked to pricing updates, lifecycle transitions, or competitive activity.
In a contextual analytics enterprise setup, marketing teams interpret performance based on customer behavior and strategy changes, not just raw numbers.
3. Finance and operational analytics
Finance and operations rely heavily on consistent definitions and aligned interpretation. Without context, even basic metrics can create confusion.
-
Metric observed: Conflicting revenue numbers across reports
-
Missing context: Different calculation logic used by teams
-
Likely wrong interpretation: Data inconsistency or reporting errors
-
Better conclusion with context: Misaligned definitions across systems
Operational metrics can also be misleading without context. For example, service delays might be attributed to internal inefficiency when, in reality, they are caused by external disruptions like supply chain issues.
Applying enterprise analytics best practices ensures that metrics are interpreted with shared definitions and real-world conditions in mind. This reduces confusion and helps teams respond more accurately.
Common analytics problems caused by missing context
When the business context is missing, analytics starts creating friction instead of clarity. The same data that should guide decisions ends up slowing teams down or leading them in the wrong direction.
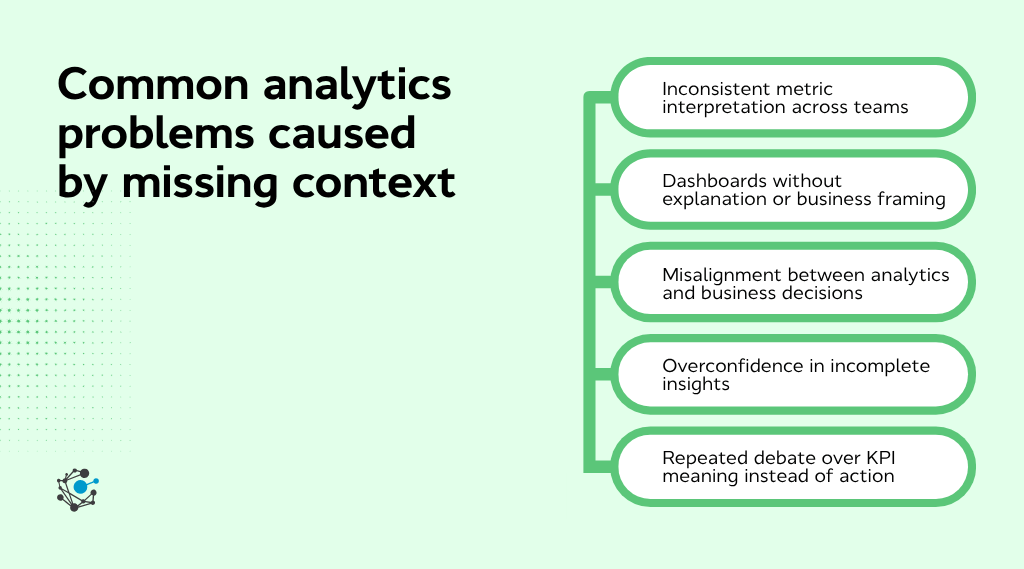
Here are the most common problems that show up:
-
Inconsistent metric interpretation across teams: Sales, marketing, and finance define and read the same KPI differently, leading to conflicting conclusions.
-
Dashboards without explanation or business framing: Teams can see what changed, but not why it changed or how to respond.
-
Misalignment between analytics and business decisions: Insights do not translate into clear actions, causing delays or incorrect priorities.
-
Overconfidence in incomplete insights: Teams act quickly on partial data without understanding underlying conditions.
-
Repeated debate over KPI meaning instead of action: Time is spent aligning on definitions instead of solving the problem.
These issues highlight the importance of business context in enterprise analytics. Without it, analytics becomes a source of confusion rather than a tool for decision-making.
How organizations can start building context-aware analytics today
Building context-aware business intelligence does not require a full system overhaul. It starts with improving how teams interpret and use existing analytics. The goal is to make insights easier to understand and act on in real business scenarios.
Audit where context is missing in the current analytics
The first step is to review how analytics is currently being consumed across teams. Most organizations already have dashboards and reports in place, but many of them lack clarity at the interpretation level.
Start by looking for situations where teams can see a number but cannot explain:
-
what the metric includes
-
why it changed
-
how it should be interpreted in a business context
This audit should focus on usability, not data accuracy. The objective is to identify where analytics fails to support decision-making, even when the data itself is correct.
In practice, organizations that use platforms like OvalEdge’s data catalog can make this process easier by bringing metadata, definitions, and usage context into a single layer. This allows teams to quickly trace how metrics are defined and where gaps in context exist.
Standardize the business meaning behind key metrics
Once gaps are identified, the next step is to align on how key metrics are defined and understood across the organization.
Focus on the most decision-critical KPIs and ensure:
-
shared definitions across teams
-
consistent calculation logic
-
clear agreement on what the metric represents in business terms
This is where many organizations struggle. Definitions often live in scattered documents or team-specific dashboards.
A more structured approach is to maintain a centralized business glossary that connects business terms with underlying data assets. OvalEdge’s business glossary allows organizations to standardize KPI definitions, link them directly to datasets, and make that meaning accessible across teams.
This reduces ambiguity and ensures that when teams discuss a metric, they are working from the same understanding. It is a core part of enterprise analytics best practices.
Bring business users into interpretation workflows
Analytics teams alone cannot define business context. Interpretation requires input from the teams that actually use the data to make decisions.
That means involving stakeholders from:
-
sales
-
marketing
-
finance
-
operations
These teams provide the real-world conditions, assumptions, and constraints that shape how metrics should be read.
To support this collaboration, organizations need visibility into how data flows across systems. OvalEdge’s data lineage capabilities help teams trace where a metric originates, how it is transformed, and what upstream changes may be influencing it. This makes discussions more grounded and reduces time spent debating data accuracy.
When business users are part of the interpretation process, analytics becomes more aligned with actual decision-making. This is what enables effective data-driven decision-making across the organization.
|
Did you know? The Cisco 2026 Data Privacy Benchmark Study found that 46% of organizations say clear communication about data use is the most effective way to build trust, reinforcing the role of shared context in analytics. |
Conclusion
The importance of business context in enterprise analytics comes down to one thing: better context leads to better decisions.
When teams understand what metrics mean and why they change, analytics become actionable, not just informational. It reduces confusion, aligns teams, and improves decision quality.
If you want to bring this clarity into your analytics, platforms like OvalEdge help connect data with business context through glossary, lineage, and governance.

You can book a demo with OvalEdge to see how this works in practice.

Next time you see a number change, ask: do we understand it, or are we just reacting?
FAQs
1. How do you add business context to existing dashboards?
Add context by documenting metric definitions, linking KPIs to business goals, and including annotations for changes like campaigns, pricing updates, or seasonality. This helps users understand why numbers change, not just what changed.
2. What is the difference between data context and business context?
Data context explains technical details like source, schema, or transformations. Business context explains how that data relates to goals, processes, and decisions. Both are important, but business context drives interpretation and action.
3. What tools help provide business context in analytics?
Tools like data catalogs, business glossaries, and data lineage platforms help connect data with business meaning. They make it easier to understand definitions, trace data flow, and align teams on how metrics should be interpreted.
4. How does business context reduce decision-making errors?
Business context reduces errors by providing clarity around metric meaning and influencing factors. It prevents teams from acting on incomplete insights and helps them focus on the actual drivers behind performance changes.
5. How do teams ensure consistent interpretation of KPIs?
Teams ensure consistency by standardizing KPI definitions, aligning calculation logic across systems, and creating a shared reference for business meaning. Regular collaboration between business and analytics teams also helps maintain alignment.

.png?width=1081&height=173&name=Forrester%201%20(1).png)
.png?width=1081&height=241&name=KC%20-%20Logo%201%20(1).png)