.jpg)
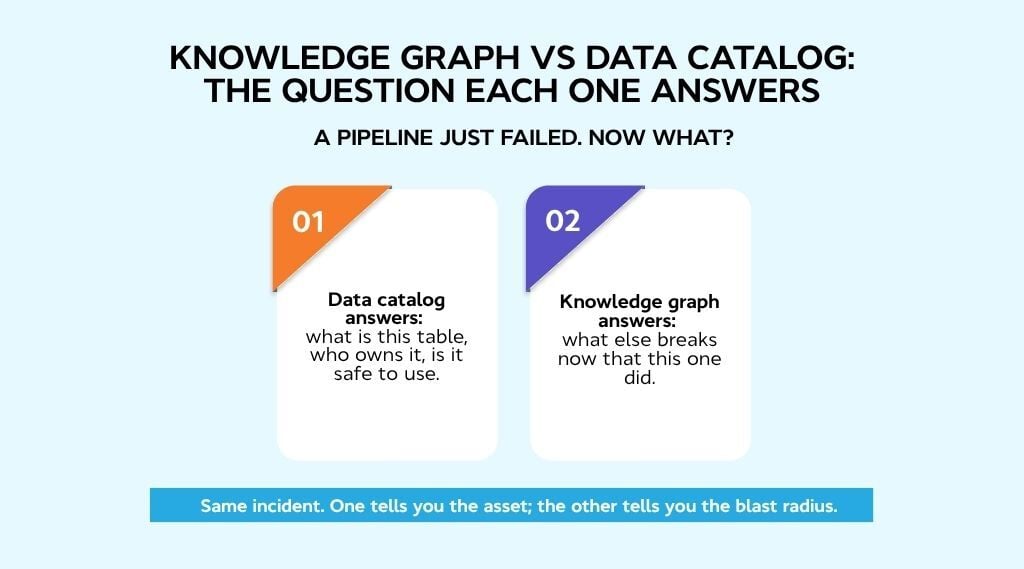
A data catalog tells you what data exists and where to find it. A knowledge graph tells you how that data connects to everything else it touches. That difference sounds academic until you're the one trying to answer "what breaks if we deprecate this column," and the catalog gives you a list of tables while the graph gives you a traversable answer.
Most vendors selling into this space skip past the difference and land on "you need both," which is true and not particularly useful when you're the one deciding what to fund this quarter. The honest answer is that these tools solve different problems, and the sequence you build them in matters more than which one you pick first.
This piece breaks down what each one actually does, where the real overlap sits, and how to figure out which gap you're actually trying to close.
Knowledge graph vs data catalog: The short answer
A data catalog inventories what data you have, where it lives, and who owns it. A knowledge graph models how entities, concepts, and metadata relate to each other, storing those relationships as data rather than as joins. They solve different problems, and most enterprises need both, usually in that order.
|
Particulars |
Data Catalog |
Knowledge Graph |
|
Core question |
Where does this data live? |
How does this connect to that? |
|
Orientation |
Asset-centric: tables, columns, dashboards |
Entity-centric: customers, products, concepts |
|
Structure |
Metadata repository, rows and columns |
Nodes and edges, relationships first-class |
|
Backed by |
Search index plus relational store |
Ontology plus graph store |
|
Answers |
Where, who, when |
How, why, what-if |
|
Best for |
Discovery, governance, compliance, ownership |
Multi-hop reasoning, impact analysis, AI grounding |
|
Typical user |
Analyst, steward, data engineer |
AI agent, data architect, search system |
|
Update model |
Continuous ingestion from connectors |
Periodic ontology and entity refresh |
|
Fails at |
Explaining meaning and relationships |
Being a usable front door for business users |
|
Time to value |
Weeks to months |
Quarters, unless built on existing metadata |
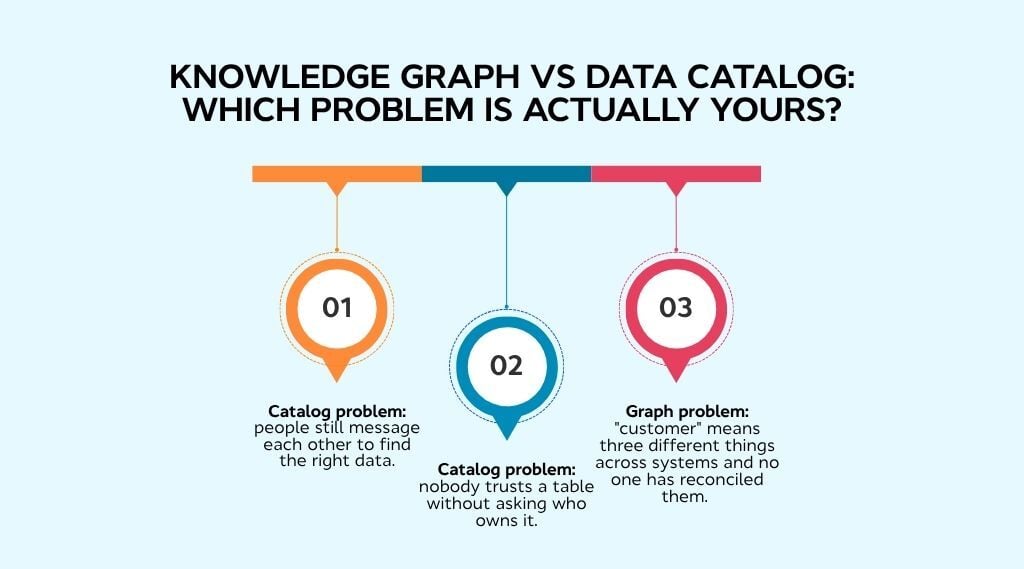
For most teams, the real question isn't which one to buy. It's whether the catalog you already own needs a graph underneath it.
What a data catalog actually does
A data catalog exists so people stop asking each other what cust_ltv_rtn means. At its core, it's a metadata inventory: table and column names, descriptions, freshness indicators, and usage statistics that tell you what data exists and whether it's safe to trust.
Layered on top of that inventory sits a business glossary that links governed definitions to the physical assets they describe, lineage and impact tracing that show where data came from and where it flows, and governance controls such as certification, access policies, and sensitivity classification.
Collaboration features (ownership tags, comments, popularity signals) turn tribal knowledge into something searchable instead of something you have to ask around for.
Take a "Customer Transactions" table. In a well-run catalog, that table shows its source systems, its owner, linked glossary terms, upstream lineage, a PII flag, and a completeness score. An analyst knows in ten seconds whether it's the right table and whether they're allowed to use it. That's the job, and it's a real one.
That gap is the catalog's real ceiling. Coverage stalls, glossary terms exist without links to the assets they define, and relationships that should be simple ("what breaks downstream") turn into expensive joins instead of a quick lookup. A catalog was built to answer where. It was never designed to answer why.
What a knowledge graph actually does
A knowledge graph models the world, not the warehouse. Instead of rows and columns, it stores nodes (entities like customers, products, or concepts) and edges (the relationships between them), and those relationships are stored as data rather than inferred each time someone writes a query. That distinction does a lot of work. Relationships become first-class and traversable instead of something you calculate on the fly.
An ontology backs the model with semantics, so "customer" can mean one consistent thing across CRM, billing, and support, or the graph can tell you exactly how the meanings diverge. The model can also infer relationships nobody explicitly declared, walk three hops out for roughly the cost of walking one, and extend to new source types without a schema rebuild.
Take the same "Customer Transactions" table. In a graph, it isn't a row with attributes. It's a node connected to the orders it feeds, the customer entity it describes, the three dashboards downstream, the steward who owns it, the GDPR policy that applies, and the "Net Revenue" glossary term whose calculation depends on it. Ask what breaks if you deprecate the column, and you traverse the graph instead of writing a query from scratch.
|
Pro tip: Ontology modeling is where most graph projects lose momentum. Budget months, not weeks, and treat a stale ontology as worse than no ontology at all, because people trust it by default. |
The ceiling shows up elsewhere: entity resolution across systems is the step teams most underestimate, and a graph fed by its own separate extraction pipeline goes stale within a quarter if it isn't tied to metadata that's actively maintained.
Knowledge graph vs Data catalog: Head-to-Head across seven jobs
Feature lists don't help you decide between these two. Jobs do. Here's how each one performs against the seven things enterprises actually buy these tools for.
|
Job |
Data Catalog |
Knowledge Graph |
Verdict |
|
Data Discovery |
Keyword search, filters, tags, certification badges, popularity signals built for a human scanning a results list |
Concept-based discovery: "everything downstream of customer churn" returns assets nobody tagged, because the relationship exists whether or not someone documented it |
Catalog for finding what you're looking for. Graph for finding what you didn't know to look for. |
|
Data Lineage |
Lineage as a feature, parsed from SQL, ETL scripts, and BI definitions, then drawn as a diagram |
Lineage as a property of the model itself no separate feature, because lineage is just edges |
Both give you lineage. Graph-backed lineage scales to column level across systems without custom stitching, and survives pipeline changes. |
|
Business Glossary & Semantics |
Stores definitions, links terms to assets, runs the approval workflow |
Enforces definitions as an ontology, propagates them across connected assets, reasons over the term hierarchy |
Catalog documents meaning. Graph operationalizes it. |
|
Business Context |
Captures context as attached metadata: glossary links, tags, descriptions, ownership notes sitting alongside an asset (static, asset-bound) |
Operationalizes context as relationships between concepts. e.g. "Net Revenue" is a node connected to its calculation logic, fiscal calendar, source tables, and dashboards |
Catalog documents business context. Graph connects it to everything it actually depends on. |
|
Governance & Policy Enforcement |
Certification workflows, access requests, classification rules, stewardship queues, audit trails |
Automatic policy propagation across connected assets, impact analysis across dependency chains, source-to-record provenance |
Catalog runs governance. Graph makes governance propagate. Neither is optional in a regulated environment. |
|
AI & Agent Readiness |
The retrieval surface locates relevant assets by concept rather than table name, optimized for human interpretation |
The reasoning substrate GraphRAG depends on resolves authorization, freshness, schema alignment, and transformation logic at query time |
Catalog gets your agent to the data. Graph gets it to the right answer. |
|
Time to Value |
Weeks to months: connectors, ingestion, glossary seeding, steward onboarding |
Quarters from scratch (ontology design, entity resolution, extraction pipelines); dramatically faster when built on an already-governed catalog |
Sequence beats simultaneity. Catalog first is the shortest path to a graph that actually works. |
Worth calling out on AI & Agent Readiness: A knowledge graph also enforces consistent entity definitions before data reaches model pipelines and tracks provenance so every output is auditable back to source; that's a governance story as much as it's an AI one. And on Time to Value: teams building agentic AI directly on raw graph databases typically hit the governance gap six to nine months in, once custom validation and semantic constraint logic start growing faster than the application itself.
Metadata graph, context graph, semantic layer: How the terms actually relate
If you've been pitched a "metadata graph," a "context graph," and a "semantic layer" in the same week and couldn't tell them apart, that's not your fault. Vendors use these terms interchangeably, but they actually describe three tiers that build on each other.
-
Tier 1 — Metadata Graph: your catalog's contents represented as nodes and edges instead of rows and columns. Captures what your data is and how it connects.
-
Tier 2 — Knowledge Graph (built on Tier 1): adds ontology and business concepts on top. Now it knows what things mean, not just how they link.
-
Tier 3 — Context Graph (built on Tier 2): adds decision traces, business rules, temporal validity, and persona context. Answers how and why something gets used.
Each tier depends on the one below it holding up. Vendors don't agree on the boundaries. DataHub calls their metadata knowledge graph a context graph; Promethium treats the context graph as a separate layer above both. The hierarchy holds even where the labels don't.
The Convergence: Knowledge graph-powered data catalogs
A knowledge graph is only as good as the metadata it's built on. It doesn't replace the work of inventorying assets, documenting ownership, and maintaining lineage; it depends on that work being done first and kept current. The versus framing obscures this. Most modern catalogs are already graph-backed underneath, which means the real question isn't catalog or graph. It's whether your metadata is complete and governed enough for a graph on top of it to hold up.
What changes when your catalog runs on a graph:
-
New source types get represented without remodeling the schema
-
Relationship queries stop requiring joins; the connections are the data
-
Policy propagates across connected assets automatically; tag one thing, everything downstream inherits it
-
Impact analysis spans systems, not just one warehouse
-
Lineage survives pipeline changes with nothing to re-stitch
-
Agent-ready context becomes a property of the architecture, not a separate AI project
How vendors approach this:
-
data.world runs a cloud-native catalog on a knowledge graph foundation, treating metadata as interconnected nodes and edges with knowledge as a first-class citizen; its AI Context Engine layers on top for accuracy.
-
Stardog's Knowledge Catalog harvests metadata from Collibra, Microsoft Purview, Databricks Unity, and JDBC sources into an enterprise metadata knowledge graph, semantically enriching technical metadata with business concepts.
-
Atlan's Enterprise Data Graph connects assets, policies, people, and business concepts, with each asset carrying business context, technical lineage, and governance metadata delivered to agents through MCP.
-
DataHub treats the metadata graph as its baseline layer with a context graph on top, and is explicit that terminology is inconsistent across the industry.
-
OvalEdge combines catalog, glossary, lineage, and access controls in one governed model, so relationships are inherited from metadata that's already continuously updated rather than rebuilt in a parallel pipeline; column-level lineage is generated automatically from SQL, PL/SQL, ETL, BI reports, and data models across 150+ connectors, with glossary terms linked directly into the lineage graph.
Which do you need? A maturity-based decision matrix
Every vendor on this topic ends at "they work together." True, and useless if you're deciding what to fund this quarter. Score yourself against four maturity dimensions, and the answer tends to fall out on its own.
|
Dimension |
Low Maturity |
Medium Maturity |
High Maturity |
|
Metadata Maturity |
Under 50% of critical columns documented; ownership incomplete |
50–80% coverage; ownership assigned but inconsistently maintained |
80%+ coverage, continuously ingested from connectors, ownership current |
|
Governance Maturity |
No certification workflow; access requests handled manually |
Certification exists, but coverage is partial |
Certification, access policy, and classification run as a standing process |
|
AI Maturity |
No agents in production; AI use is exploratory |
Agents piloted for retrieval or search use cases |
Agents in production making decisions, requiring query-time resolution |
|
Semantic Maturity |
Glossary terms exist but aren't consistently linked to assets |
Terms linked to assets; some cross-system conflicts unresolved |
Terms modeled with relationships; conflicts across systems made explicit |
Reading the matrix:
If you're low on metadata or governance, fix that first. A graph on top of sparse or ungoverned metadata connects gaps; it doesn't fill them in.
If you're high on metadata and governance but low on AI or semantic maturity, you're at the actual investment point; this is where a knowledge graph earns its complexity.
If you're high across all four dimensions, the graph isn't a future project anymore; it's overdue, and the risk shifts to staying relational too long.
The sequence that actually works: catalog and connectors → glossary and coverage above 70% on critical assets → graph-backed relationships → agent access.
Teams that skip to step three build a graph that goes stale within a quarter because it's fed by its own extraction pipeline rather than by metadata already being maintained. The sequence isn't conservatism; it's the difference between a graph that survives contact with production and one that doesn't.
What goes wrong: Three failure patterns
Most of what gets written about knowledge graphs assumes the project succeeds. In practice, a good number of them don't, and the failures tend to follow the same three shapes regardless of vendor or industry. None of them are technology problems. They're sequencing problems that show up as technology problems once something's already been built.
Buying a graph to fix a coverage problem
A graph is only as good as the metadata feeding it. If 35% of your columns have descriptions, a graph gives you a beautifully connected map of that 35%, and total silence about the rest. Worse, the silence now looks intentional, because the structure implies completeness that isn't there.
-
The tell: the graph looks finished, but half your assets never show up in a traversal because nobody documented them in the first place.
-
The fix: coverage is a stewardship problem. No architecture solves it, including this one.
The metadata silo, doubled
Gartner has repeatedly warned that a data catalog disconnected from the rest of the enterprise is just another metadata silo. Add a graph that's also built and maintained separately, and you don't get a fix; you get two silos and a reconciliation project between them.
-
The tell: your graph and your catalog disagree about who owns a table.
-
The fix: one system of record for metadata, with the graph reading from it rather than maintaining its own parallel truth.
The parallel pipeline
This is the most common and most expensive failure of the three. The graph gets built from its own extraction pipeline instead of from the catalog's continuously updated metadata. It looks accurate at launch and is visibly drifting by month two, because nothing keeps the two systems in sync.
-
The tell: a finance metric traced from its glossary definition through the warehouse tables and transformation pipelines to a dashboard; that trace only holds up because the chain was already built in the catalog, not because the graph created it.
-
The fix: populate the graph from a source that's already maintained, so it inherits updates automatically instead of needing its own maintenance team.
Knowledge Graph vs Data Catalog: The Bottom Line
It isn't a versus. Enterprises that get this right invest in governed metadata first: complete coverage, current ownership, working lineage, because that's what everything downstream depends on.
Knowledge graphs get layered on top of that foundation where the use case justifies the added complexity, whether that's multi-hop reasoning across systems, semantic relationships a flat glossary can't hold, or AI agents that need more than a search result to act on. The graph isn't the starting point, and it isn't optional forever either. It's what you build once the metadata underneath it can actually support it.
If you're weighing one against the other right now, the real question isn't which to buy. It's whether the catalog you already run is built to carry a graph on top of it.
OvalEdge combines catalog, glossary, lineage, and governance in one continuously updated model, so if you get to the graph question, you're not starting from zero.

See how OvalEdge handles this → Book a demo now.
.png?width=1081&height=173&name=Forrester%201%20(1).png)
.png?width=1081&height=241&name=KC%20-%20Logo%201%20(1).png)