.jpg)
An impact check that returns a list of affected tables leaves most of the work undone. Column-level data lineage tracks how each field moves and changes across systems, down to which source column it came from and which reports read it, so the same check returns the exact fields at risk.
The problem grows with table width. Warehouse tables regularly hold more than a hundred columns, so an alert naming the table rules almost nothing out. Teams then test every change as if it were high risk or stop reading the alerts entirely, and both habits end with a lineage graph nobody trusts.
This guide covers how column-level lineage is built, what breaks it, how it supports impact analysis and compliance, and how Snowflake, Databricks, and dbt handle it today.
What is column-level data lineage?
Column-level data lineage is a record of how every individual field is created and used across an organization's systems. It maps each column back to the source columns it came from, captures the logic applied at each step, and lists the tables, dashboards, and models that read it downstream.
Four things get recorded for every field:
-
Origin: the raw column or columns a field traces back to
-
Transformation: the joins, filters, aggregations, and calculations applied along the way
-
Dependencies: which upstream columns feed the field, and which reports and models consume it
-
Usage: how often the field is queried, and which teams rely on it
Terminology varies by tool. Column-level lineage, field-level lineage, and field-level data lineage all describe the same practice. Warehouse documentation favours column, while ETL (extract, transform, load) and application documentation favour field.
The level of detail matters because of how people query data. A production query names specific columns in its select and filter clauses, so the column is the unit engineers work in. Column lineage in a data warehouse that stops at the table boundary answers a broader question than the one being asked of it.
Column-level vs table-level lineage
Table-level lineage records which datasets feed each other. Column-level data lineage records the same relationships one level down, at the field that carries them. The difference shows up in what each can answer: the first confirms that two datasets are related, and the second identifies which field created the relationship, how it was calculated, and what depends on it.
|
Dimension |
Table-level lineage |
Column-level lineage |
|
Setup effort |
Low, often available natively |
Higher, needs schema resolution first |
|
Root cause analysis |
Narrows the search to a table |
Identifies the source column |
|
Sensitive data tracking |
Flags a table as holding regulated data |
Follows the field into every column that inherits it |
|
False positives on wide tables |
High |
Low |
|
Metadata and ownership |
Attaches to the table |
Attaches to individual fields |
|
Graph size |
Readable at a glance |
Large, filtering required |
|
Maintenance |
Can survive manual upkeep |
Automation required |
|
Typical source |
Job and pipeline metadata |
SQL parsing and lineage events |
Table-level lineage still does real work. It is enough for mapping which systems exchange data, tracking job dependencies in an orchestration tool, and onboarding new engineers who need an overview first. Column-level lineage earns its higher setup cost when the task involves changing, debugging, or classifying a specific field.
Both levels treat every dependency the same way. Column dependencies come in two kinds, and how a tool handles the second kind decides whether its graphs stay readable.
Direct vs indirect column lineage
Direct and indirect describe the two ways one column can depend on another. A direct dependency carries the input value into the output. An indirect dependency shapes which rows appear or how they group, without feeding the result itself.
A currency conversion shows the direct case:
SELECT amount_cents / 100.0 AS amount FROM raw_orders
Here, amount derives from amount_cents.
A filtered aggregate shows the indirect case:
SELECT customer_id, SUM(amount) AS revenue FROM orders WHERE region = 'EMEA' GROUP BY customer_id
No part of revenue comes from region. Yet region decides which rows get summed, so it still moves the number. The same holds for customer_id in the GROUP BY clause.
The OpenLineage specification names the common indirect types: GROUP_BY, FILTER, JOIN, SORT, and AGGREGATION. A labeled type explains why a dependency exists, not only that it does.
Graph size is the trade-off, and it is where column-level data lineage tools diverge. OpenLineage warns that recording every indirect dependency as an edge leaves each target field depending on each source field, close to a Cartesian product across both datasets.
The opposite approach ignores columns that appear only in WHERE, GROUP BY, ORDER BY, JOIN, HAVING, or PARTITION BY clauses, so a field used purely as a filter leaves no trace in the graph.
Both positions are defensible, which makes this worth raising during evaluation. Ask whether the tool labels indirect dependencies by type, and whether a user can hide them on demand.
How column-level lineage works
Column-level data lineage is built by parsing the code that already moves the data. A parser reads the SQL behind every view, model, and dashboard query, works out which input columns produced which output columns, and records each pair as an edge in a graph. What that graph covers depends on how the parsing runs, where the metadata comes from, and whether separate tools can be stitched into one view.
SQL parsing and the abstract syntax tree
SQL parsing turns query text into a structure a machine can reason about. The parser converts each query into an abstract syntax tree (AST), which captures what the query does independent of how it was written, then walks the tree to match every output column to its inputs.
The work runs in four steps.
-
Collect the queries from warehouse history, compiled transformation code, and dashboard definitions.
-
Parse each one into an AST. SQLGlot is a common open-source choice for this step.
-
Resolve the references. In SELECT name, email FROM customers JOIN accounts ON customers.id = accounts.customer_id, nothing states which table holds name. The parser reads both schemas before it can answer.
-
Emit the edges, recording which inputs produced which outputs and by what transformation.
Step three explains why column lineage in a data warehouse depends on a catalog. Query logs alone can produce table-level lineage. Column-level data lineage needs schemas, because unqualified references and SELECT * say nothing about their origin without them. Platforms that build lineage by parsing source code [link: /blog/data-lineage-techniques] crawl schemas first for this reason, and teams that skip that step end up covering part of the estate with no way to tell which part.
The shape of the transformation decides what the parser records next. Four patterns cover most of a working warehouse.
The four derivation patterns
Almost every column in a warehouse is derived in one of four ways: direct reference, rename, expression, or aggregation. Each one leaves a different trace in the lineage graph, and each one is a different level of difficulty for the parser.
Direct reference:
SELECT order_id FROM stg_orders
fct.order_id comes from stg_orders.order_id, unchanged. These make up most edges in a typical graph and parse reliably.
Rename:
SELECT order_id AS id FROM stg_orders
fct.id comes from stg_orders.order_id. The value is identical, and the name is not, which is why tools that match columns by name lose the trail here.
Expression:
SELECT amount_cents / 100.0 AS amount FROM raw_orders
stg. amount comes from raw.amount_cents, converted. Recording the expression alongside the edge matters, because "how is this number calculated" is the question people actually ask.
Aggregation:
SELECT customer_id, SUM(amount) AS revenue FROM orders GROUP BY customer_id
fct.revenue rolls up orders.amount, with an indirect dependency on customer_id from the GROUP BY.
Direct references and renames are safe to trust across any tool. Expressions are worth checking, since some tools record the edge without the logic behind it. Aggregations are where tools diverge most, depending on how each one treats the indirect side.
That covers what parses cleanly. The next question is where the raw material comes from.
Where lineage metadata comes from
Column-level data lineage draws on three sources: query logs from the warehouse, transformation artifacts from tools like dbt, and lineage events emitted by pipelines. Most production setups use all three, since each covers ground the others miss.
|
Source |
What it covers |
Where it falls short |
|
Query logs and history |
Every query that actually ran, including ad-hoc work and pipelines nobody documented |
Dialect edge cases, and one-off queries that clutter the graph |
|
Transformation artifacts |
Precise model and column definitions inside the transformation project |
Stops at the project edge, leaving upstream sources and downstream dashboards invisible |
|
Emitted lineage events |
Custom pipelines, Spark jobs, and systems with no native connector |
Decays unless emitted by code that runs on every execution |
Retention trips up more teams than any other gap here. Warehouses expose query history through system views, and each sets its own limit. Databricks lineage system tables hold a rolling one-year window and drop anything older.
Ingestion configs add a second limit, because backfill windows often default to a day or two, which produces a graph covering last week only. A window spanning a full business cycle, monthly and quarterly jobs included, is the safer setting.
Duplicate nodes are the failure worth asking vendors about. Every source should land in one shared graph, with a column carrying the same identity whichever source found it. Tools that read query history and transformation metadata separately record the same column twice, as two nodes with no connection between them.
Coverage improves with every source added. Completeness is a harder problem, and it starts at the edge of each tool.
Why end-to-end column lineage is hard
End-to-end column lineage is hard for two reasons: no tool sees past its own perimeter, and some queries cannot be parsed at all. Every platform in the stack tracks lineage accurately inside its own walls and reports nothing about what happens once data leaves.
Stitching those views together is the first problem. A column that starts in a source system, moves through a dbt model, lands in a warehouse table, and surfaces in a dashboard passes through four systems that each name it differently. Column-level data lineage that spans the full path needs that column to hold one identity across all four.
The second problem is SQL that the parser cannot read.
-
Stored procedures: Loops and conditional logic have no single lineage path a static parser can resolve.
-
Dynamic SQL: The query is assembled at runtime, so there is nothing to read in advance.
-
Hardcoded table names in dbt: Bypassing ref() hides the dependency from the project graph, with no error raised.
-
User-defined functions: The parser sees a function call and cannot look inside it.
-
Path references: Databricks cannot capture column lineage when a source or target is referenced by storage path rather than table name.
Accuracy claims deserve a closer look because of this. Any headline percentage averages across query types. Parsers handle plain SELECT statements almost perfectly and lose ground on the complex queries that carry the most business logic, so a single number hides the cases that matter most.
The question to put to a vendor is what happens to a query the parser fails on. A tool that flags those queries leaves a known gap. A tool that drops them silently produces a graph that looks complete and is not.
Complete or not, lineage only pays off once someone uses it. Four situations account for most of that use.
Column-level lineage in practice
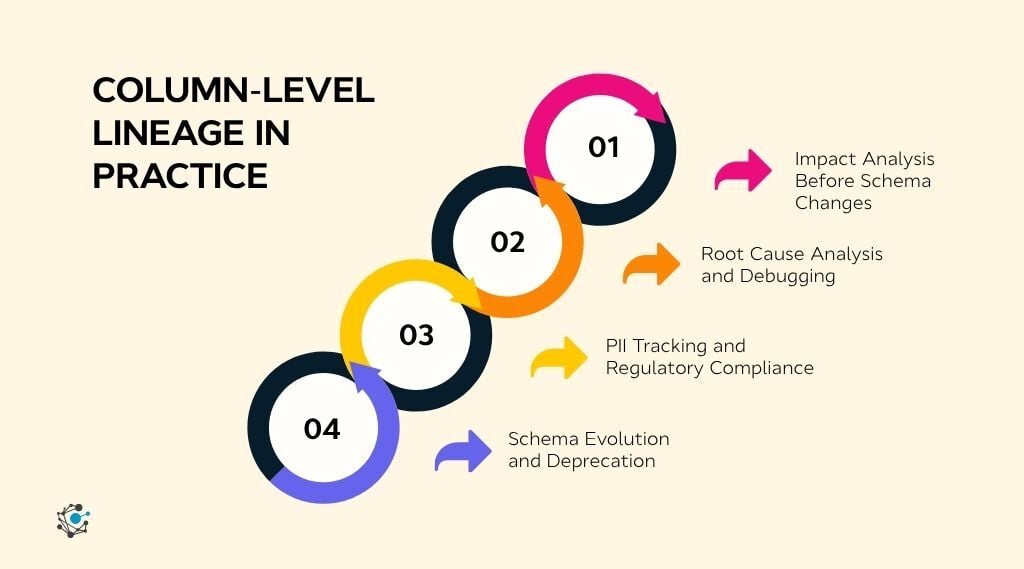
Column-level data lineage supports four operational workflows: impact analysis before schema changes, root cause analysis when a number looks wrong, tracking regulated fields across systems, and retiring columns nobody reads. Each one runs as a traversal of the lineage graph, moving downstream from a column to find what depends on it, or upstream to find what produced it.
|
Workflow |
Traversal |
What the query returns |
|
Impact analysis |
Downstream from the changed column |
Every asset that reads the field |
|
Root cause analysis |
Upstream from the wrong value |
The transformation where the value diverged |
|
PII tracking |
Downstream from the tagged source column |
Every derived column inheriting the classification |
|
Deprecation |
Downstream, filtered to zero results |
Columns with no readers |
Impact analysis before schema changes
An impact check runs as a downstream traversal from the column being changed. The graph returns every asset that reads that specific field, ordered by how many hops separate it from the source, so a direct consumer and a dashboard four transformations away are both visible and distinguishable.
Hop distance matters for triage. A rename breaks anything referencing the old name at the first hop. A type or unit change travels further, since each downstream transformation inherits the new values without erroring, and the failure surfaces as a wrong number instead of a broken job.
Wiring the check into continuous integration is what makes it consistent. dbt's documentation notes that analytics engineers who can see the full scope of a proposed change during development write higher-quality pull requests needing fewer edits. A check that posts dependent assets into the pull request applies that to every change, not only the ones someone remembers to verify.
Root cause analysis and debugging
Debugging runs the same traversal in reverse. Starting from the incorrect value, the graph returns the chain of transformations that produced it, and every node in that chain is a place to check whether the value was already wrong on the way in.
That turns an open search into a bisection. Instead of reading every query in the pipeline, an engineer checks the midpoint of the chain, then narrows to whichever half carries the bad value. A chain of sixteen transformations resolves in four checks.
dbt documents the common version of this, where a failing test on one column started with an untested column upstream. This is also the easiest benefit to quantify, since most teams already track how long incidents take to detect and resolve.
PII tracking and regulatory compliance
A classification applied to a source column propagates along the lineage edges into every column derived from it. Tagging a Social Security number field once at the raw layer marks every downstream field carrying that value, including fields built by people who have since left.
Table-level tagging cannot do this. Marking a whole table as sensitive either restricts columns that are safe to share or misses derived fields sitting in tables nobody flagged.
Snowflake builds this into its lineage view, letting a user trace a column, spot fields that should carry tags, and apply them in the same workflow. OpenLineage adds a related signal by recording whether a transformation obscured the value, so a hashed field reads differently from one passed through in the clear. The case worth finding before an auditor does is a regulated field feeding an aggregate everyone treats as safe, which is the kind of evidence data lineage for regulatory reporting depends on.
Schema evolution and deprecation
Deprecation runs the downstream query with the result inverted. Rather than asking what depends on a column, it asks which columns have no downstream edges at all, and returns the candidates for removal.
The graph alone overstates safety. A column can hold a downstream edge to a table nobody has queried in two years, which is a connection without a consumer. Intersecting column-level lineage with query frequency separates the two, and safe deletions live in that intersection.
The cost line is direct. Every derived column that nothing reads still consumes compute on each pipeline run. Clearing dead nodes also keeps the graph legible, which matters more as the warehouse grows.
All four assume the graph is trusted. That trust comes from connecting the technical record to the business definitions people already use.
How to implement column-level lineage
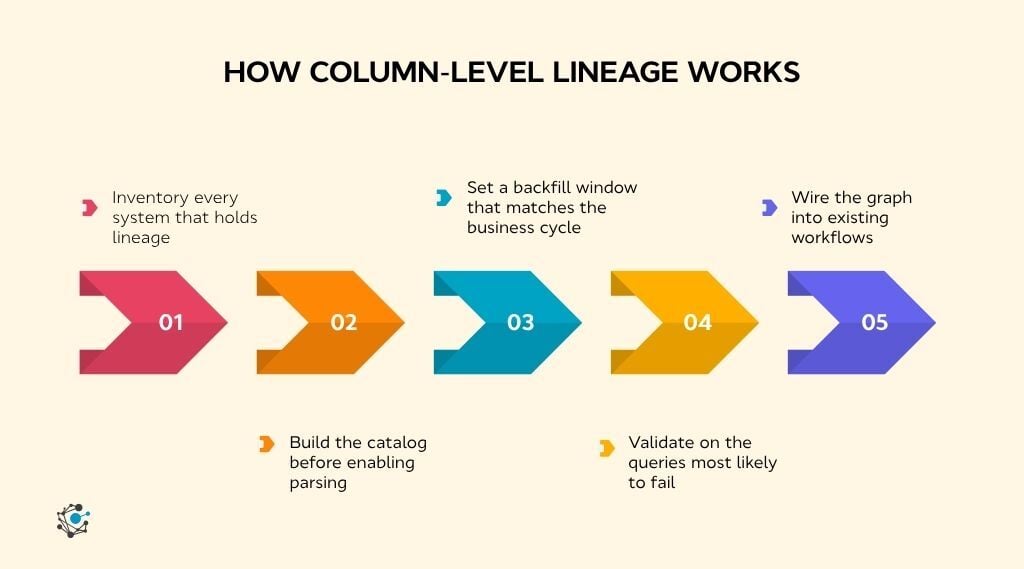
Implementing column-level data lineage takes five steps: inventory the metadata sources, build the catalog before parsing, set a backfill window covering a full business cycle, validate the parser against the estate's hardest queries, and connect the graph to workflows people already run.
Sequencing matters more than tooling here. Column-level lineage built in the wrong order produces a graph with gaps nobody can locate.
1. Inventory every system that holds lineage
List the warehouse, transformation layer, orchestration, BI tools, and reverse ETL. Mark which have native connectors and which need custom instrumentation. End-to-end column lineage depends on that second group, since one uninstrumented system breaks the chain at its boundary.
2. Build the catalog before enabling parsing
Column resolution needs schemas. Crawl tables, views, and stored procedures first, or the parser fails on references it cannot resolve and leaves no record of what it skipped. Column lineage in a data warehouse is only as complete as the schema coverage underneath it.
3. Set a backfill window that matches the business cycle
Ingestion defaults often cover a day or two, which produces a graph reflecting last week. Extend it to include monthly and quarterly jobs. Platform retention caps this: Databricks lineage system tables hold a rolling year and drop anything older, so a longer window recovers nothing beyond that.
4. Validate on the queries most likely to fail
Plain SELECT statements parse cleanly and prove little. Run the longest stored procedure in the estate, a query built with dynamic SQL, and one calling a user-defined function. What comes back is the real accuracy figure for that stack.
5. Wire the graph into existing workflows
Lineage nobody opens is documentation. Three placements make column-level data lineage operational: an automated impact check on every pull request, a first triage step in the incident runbook, and an input to quarterly access reviews.
|
Step |
What usually blocks it |
Signal it worked |
|
Inventory sources |
Systems with no native connector |
Every source has a named capture method |
|
Build the catalog |
Views and stored procedures left uncrawled |
Parser resolves unqualified column references |
|
Set backfill window |
Defaults to a day or two |
Quarterly jobs appear in the graph |
|
Validate parsing |
Testing only clean SELECT statements |
Known parse failures are listed rather than hidden |
|
Wire into workflows |
Lineage sitting in a tool nobody opens |
Impact checks appear in pull requests |
Parsing itself runs fast. The catalog groundwork in step two and the validation in step four account for most of the timeline.
Build vs buy
Building column-level data lineage is viable on a narrow stack: one warehouse, one SQL dialect, one transformation tool. An open-source parser plus schema resolution gets a team working lineage inside that boundary.
Viability breaks at the second dialect, the first BI tool, or the first stored procedure carrying control flow. Each addition brings a new parser and a fresh identity resolution problem.
Maintenance is the cost most teams underestimate. Every new source, dialect upgrade, and schema convention change is a maintenance event, and the workload grows with the stack rather than settling. Platforms like OvalEdge absorb that by parsing source code across systems and holding column identity steady as the stack changes.
Native platform lineage already covers part of this, which raises the question of where each one stops.
Column-level lineage across common platforms
Every major data platform now ships some form of column-level lineage. Each one is accurate inside its own perimeter and limited outside it. The table below covers what each handles natively and where coverage stops.
|
Platform |
Native column lineage |
What it covers |
Where it stops |
|
OvalEdge |
Yes, cross-platform |
Automated column-level lineage across 150+ connectors covering warehouses, ETL pipelines, and BI tools, with business glossary, ownership, and certification attached to each column |
Depends on connector availability per source system |
|
Snowflake |
Yes, via Horizon Catalog |
Write operations logged at column level, view dependencies parsed, tag propagation within the lineage view |
External lineage from dbt and Airflow via OpenLineage is table-level only, so column precision ends at the Snowflake boundary |
|
Databricks |
Yes, via Unity Catalog |
Column lineage across notebooks, jobs, and dashboards inside Unity Catalog |
Cannot capture column lineage when sources are referenced by storage path rather than table name, and user-defined functions break the mapping |
|
dbt Cloud |
Yes, via Catalog |
Static SQL analysis of SELECT expressions, end-to-end within the project, across Snowflake, BigQuery, Databricks, and Redshift adapters |
Enterprise plans only, and coverage stops at the project boundary in both directions |
|
BI tools |
Varies |
Some internal field lineage within the tool |
Rarely resolves fields back to warehouse columns without an external catalog |
Snowflake, Databricks, dbt, and BI tools each cover their own scope accurately and stop at their own boundary. Column-level data lineage that spans the full path needs a layer above all of them, one that resolves column identity across platforms and attaches the glossary terms, ownership, and certification those tools were never built to carry.
The evaluation question is simple: does each column hold a single identity across every tool it passes through, or does it appear as a different node in each one?
Making column-level data lineage operational
Lineage that stays inside a single tool gives a partial answer to every question asked of it. The impact check that misses one downstream dashboard, the PII trace that stops at the warehouse boundary, and the deprecation query that cannot tell a connected column from a used one all share the same cause: coverage that stops where the tool stops.
Column-level data lineage becomes operational when three things come together. The graph spans the full stack rather than one tool's perimeter. Each column holds a single identity across every system it passes through. And the technical record carries the business definitions, ownership, and certification that make it trustworthy to people outside the data team.
OvalEdge brings these layers together, connecting column-level lineage across warehouses, ETL pipelines, and BI tools with the governed metadata that gives each field business meaning.

 Schedule a demo to see how it works across your stack.
.png?width=1081&height=173&name=Forrester%201%20(1).png)
.png?width=1081&height=241&name=KC%20-%20Logo%201%20(1).png)