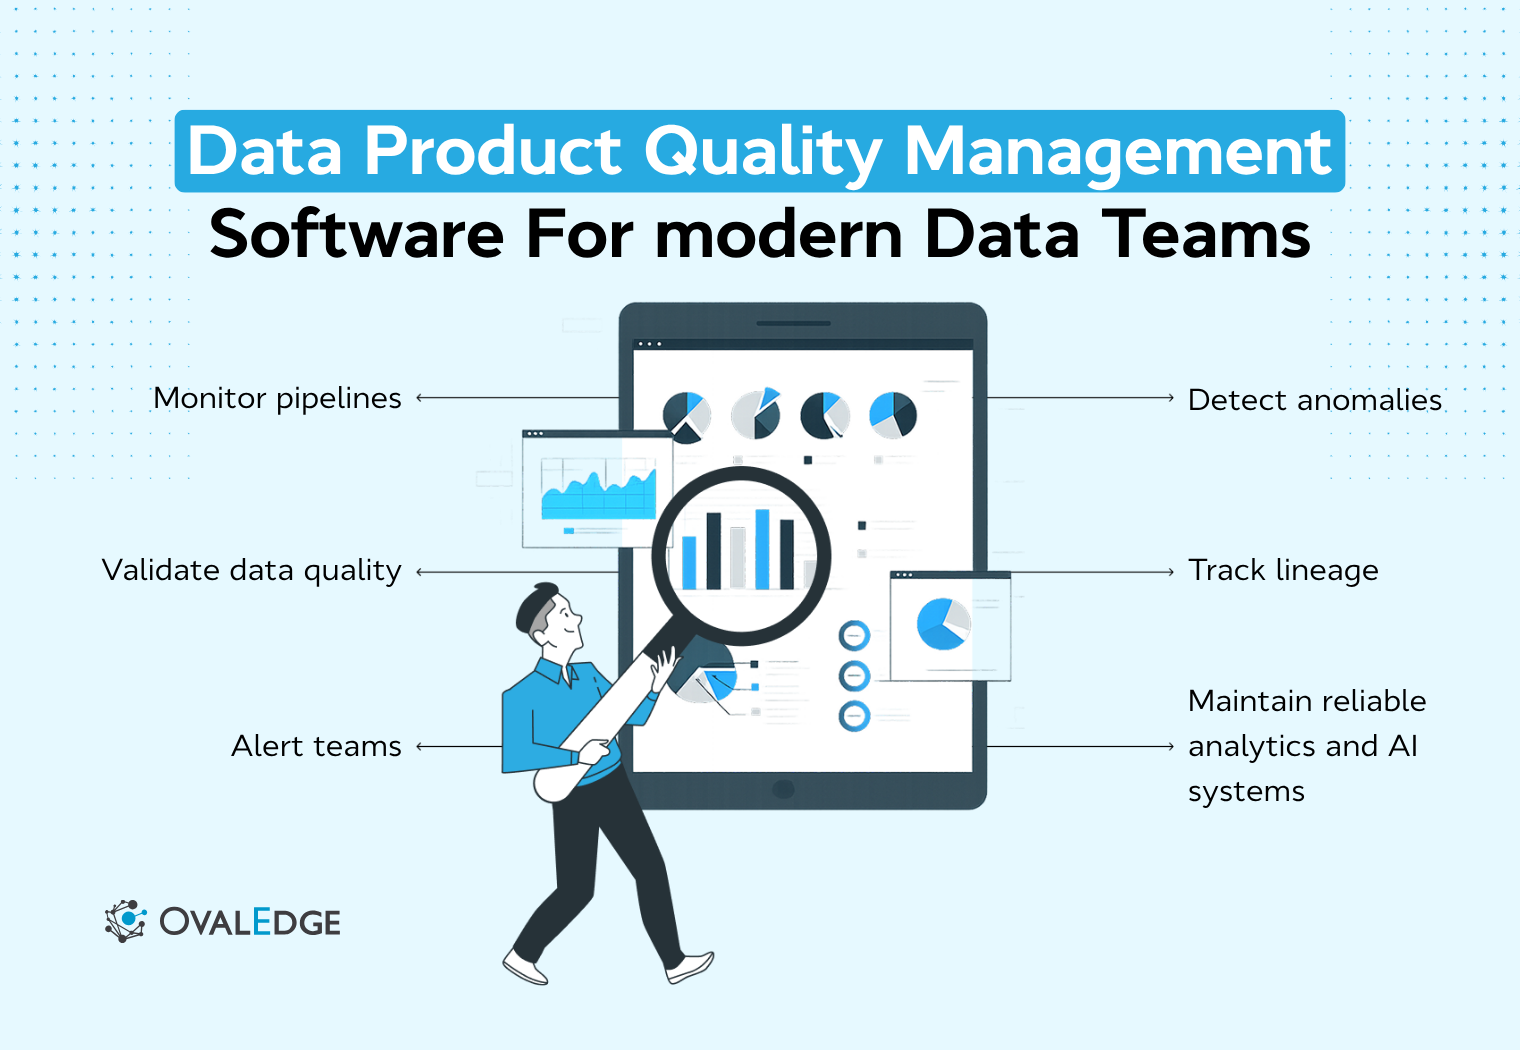
Data product quality management software helps organizations monitor pipelines, detect anomalies, and maintain reliable analytics outputs. This guide explains its role, key tools, implementation steps, and evaluation criteria. It also highlights how continuous monitoring improves data reliability, reduces operational issues, and ensures trustworthy dashboards, datasets, and machine learning pipelines.
Your dashboards look fine, and your pipelines are running, but the numbers don’t always align. That’s when data starts raising questions instead of driving confident decisions.
As organizations scale analytics and AI, data is no longer just stored and queried. It is packaged and consumed as data products such as dashboards, curated datasets, and machine learning features. These products need to be reliable, consistent, and continuously monitored, much like production systems.
This shift has created the need for data product quality management software. These platforms help teams monitor data products across their lifecycle, track reliability signals, and ensure that analytics outputs remain trustworthy as systems grow more complex.
The demand is increasing alongside AI adoption.
According to Accenture’s 2024 Data Readiness Research, 75% of executives say high-quality data is essential for strengthening generative AI capabilities.
In this guide, we’ll break down what data product quality management software is, when organizations need it, and how to evaluate leading tools based on real-world requirements and trade-offs.
What is data product quality management software?
Data product quality management software helps organizations monitor and maintain the reliability of data products used in analytics, dashboards, and AI systems. These platforms continuously track datasets, pipelines, and transformations to ensure that analytics outputs remain accurate, timely, and consistent.
Traditional data quality tools focus mainly on rule-based validation of datasets. Data observability tools monitor pipeline performance and system behavior. Data product quality management software focuses specifically on ensuring the reliability of production analytics outputs.
These platforms typically provide several capabilities that help maintain product data reliability across analytics systems.
-
Continuous monitoring across data pipelines and warehouses
-
Automated anomaly detection for unusual data patterns
-
Data lineage visibility to trace upstream dependencies
-
Reliability metrics that measure dataset health
-
Alerts and incident workflows for analytics teams
Instead of waiting for dashboards to break, monitoring systems analyze signals such as dataset freshness, data volume stability, and schema changes. These signals help teams detect issues early and prevent incorrect data from reaching decision-makers.
This approach reflects a broader shift in modern analytics operations. Data teams increasingly treat datasets and dashboards as data products that must meet defined reliability standards. Monitoring software helps maintain those standards across the analytics lifecycle.
|
Related resource: OvalEdge explains in its whitepaper From Data Chaos to Trust: How OvalEdge Powers the Next Era of Data Quality how organizations move from reactive data issue resolution to proactive monitoring and governance across the data lifecycle. |
Why modern data teams need data product reliability monitoring
Data products now sit at the center of how organizations operate. Dashboards, curated datasets, and machine learning features are used across teams to guide decisions, track performance, and automate workflows. As reliance on these assets grows, ensuring their reliability becomes a critical requirement.
1. Data products now power critical analytics and AI systems
Organizations increasingly treat data as a product designed for consumption across business and technical teams. These data products include analytics datasets, dashboards, feature stores, and APIs that support everything from reporting to machine learning.
These systems are used across finance, marketing, operations, and product teams, making them central to decision-making. As usage expands, data reliability becomes as important as application uptime, since inconsistent outputs can affect multiple teams simultaneously.
Industry research reinforces this shift. According to McKinsey’s 2023 research on AI adoption, organizations that successfully integrate data and AI into decision-making gain significant productivity and innovation advantages.
2. Traditional data quality tools cannot monitor modern pipelines
Traditional data quality tools were built for structured data warehouses and periodic validation checks. They typically rely on predefined rules that verify dataset conditions at specific points in a pipeline.
Modern analytics architectures are far more complex. Data may flow through distributed ingestion pipelines, multiple transformation layers, streaming platforms, and cloud warehouses before reaching analytics outputs.
Static validation rules often struggle to detect unexpected anomalies such as unusual metric spikes, missing records, or schema changes introduced during transformation stages.
Modern data product monitoring platforms address these limitations through automated profiling and anomaly detection. These tools continuously analyze dataset behavior, learning normal patterns and alerting teams when unusual changes occur.
3. The operational risks of unreliable data products
When data product reliability is not actively managed, the impact extends beyond technical teams and directly affects business operations.
Common business-level consequences include:
-
Delaed or incorrect reporting that affects revenue visibility and planning
-
Increased time spent validating numbers before decisions can be made.
-
Reduced trust in analytics across business and leadership teams
-
Slower decision-making due to inconsistent or unclear data outputs
For example, if revenue figures differ across reports, leadership teams may delay strategic decisions until numbers are reconciled. Similarly, inconsistent input data can affect machine learning outcomes, leading to reduced accuracy in predictions.
|
In practice, organizations that address these issues often focus on standardizing definitions and improving visibility across data assets. For instance, Delta Community Credit Union (DCCU) improved its data reliability by implementing a structured approach to data management. |
By standardizing key definitions, enabling data lineage visibility, and reducing reliance on manual spreadsheet-based processes, the organization improved consistency and trust in its analytics outputs.
These issues highlight a broader shift. Data reliability is no longer just a technical concern. It directly impacts how quickly and confidently organizations make decisions.
Signs your organization needs data product quality management software
Many organizations start with manual checks or basic validation processes to manage data quality. While these approaches work at smaller scales, they become harder to maintain as data environments grow in size and complexity.
At this stage, certain patterns begin to emerge that indicate the need for a more structured approach to managing data product quality.
1. Dashboards and analytics reports frequently break
A common signal is when teams spend increasing time verifying whether analytics outputs can be trusted. Reports may require cross-checking across multiple sources before being used for decision-making.
Instead of relying on a single source of truth, teams begin validating numbers manually, which slows down analysis and introduces delays.
Data product quality management software helps standardize how data is defined, transformed, and delivered, reducing the need for repeated validation and improving confidence in analytics outputs.
2. Data pipelines are growing rapidly
As data platforms expand, the number of ingestion pipelines, transformation processes, and dependencies across systems increases. Data flows through multiple stages before reaching analytics outputs, making it harder to maintain consistency.
At this scale, even small inconsistencies in upstream data can propagate across multiple datasets and reports.
Data product quality management platforms provide a structured way to manage these dependencies and maintain consistent data quality across interconnected systems.
|
Related resource:
OvalEdge explains in its whitepaper Data Lineage: Benefits and Techniques how organizations track data movement across pipelines and systems to improve data quality, trace dependencies, and maintain trust in analytics outputs. |
3. Scaling data product teams and analytics usage
As organizations grow, more teams begin using shared datasets and dashboards to guide decisions. Data products are no longer limited to a single team but are consumed across finance, marketing, operations, and product functions.
This expansion increases the need for standardized definitions, consistent transformations, and reliable outputs.
Data product quality management software helps ensure that all teams operate on the same trusted data, reducing discrepancies across departments.
4. Machine learning pipelines depend on data quality
Machine learning systems rely on consistent and well-structured data inputs for both training and inference. As organizations expand AI initiatives, the importance of stable data products becomes more visible.
Variations in input data, even if subtle, can affect model performance and lead to inconsistent outcomes.
Data product quality management software helps maintain consistency across feature datasets and ensures that machine learning systems operate on reliable data inputs.
Leading data product quality management software platforms Several platforms help organizations monitor analytics pipelines and maintain reliable data products. While these tools often overlap in areas such as observability, anomaly detection, and validation, each platform emphasizes different aspects of data product monitoring and reliability management.
Below are some commonly used platforms and what they offer.
1. Monte Carlo

Monte Carlo is a data observability platform designed to help teams monitor the health of analytics pipelines and datasets. It focuses on identifying anomalies across data systems by automatically analyzing patterns in datasets and pipeline behavior. The platform is commonly used in organizations running large analytics environments with complex dependencies across pipelines and warehouses.
Best features
-
Automated anomaly detection: Detects unexpected changes in dataset behavior without manual rule configuration.
-
End-to-end data lineage: Maps upstream and downstream dependencies to support root cause analysis.
-
Freshness and volume monitoring: Tracks delays and unexpected changes in data arrival and size.
-
Schema change detection: Identifies structural changes that may impact downstream analytics.
-
Reliability dashboards: Provide visibility into dataset health and incident trends.
Pros
-
Strong automation for anomaly detection
-
Effective lineage capabilities for root cause analysis
-
Scales well in complex analytics environments
Cons
-
Alert tuning may require configuration to reduce noise
-
Pricing may increase as the monitoring scope expands
Best for
Large enterprises managing complex pipelines and needing automated observability.
2. Metaplane

Metaplane is a monitoring platform focused on analytics pipelines running on cloud data warehouses. It analyzes dataset behavior directly within the warehouse environment and detects anomalies that may affect dashboards and analytics outputs. The platform is often adopted by organizations using modern cloud data stacks.
Best features
-
Warehouse-native monitoring: Monitors datasets directly within cloud warehouses.
-
Automated anomaly detection: Uses historical patterns to detect unusual behavior.
-
Dataset health dashboards: Provides visibility into dataset performance and issues.
-
Freshness and schema tracking: Monitors delays and structural changes in datasets.
-
Lightweight integration: Connects easily with modern data stack tools.
Pros
-
Strong focus on modern cloud data stack environments
-
Simple setup for warehouse-centric architectures
-
Useful insights into dataset behavior patterns
Cons
-
Monitoring coverage depends heavily on warehouse integrations
-
Fewer governance-oriented features compared to broader platforms
Best for
Teams operating primarily within cloud data warehouses.
3. Soda

Soda provides a framework for implementing data quality tests within analytics pipelines. Instead of relying primarily on automated anomaly detection, Soda allows teams to define validation rules and expectations for dataset behavior. These tests run during pipeline execution to identify reliability issues early.
Best features
-
Expectation-based validation: Allows teams to define rules for dataset behavior.
-
Pipeline integration: Runs validation checks within data pipelines.
-
Monitoring workflows: Tracks quality checks and validation outcomes.
-
Open-source flexibility: Provides customization through open-source tooling.
-
Data testing support: Supports testing-driven data engineering practices.
Pros
-
Flexible framework for implementing custom quality checks
-
Strong fit for teams practicing testing-driven data engineering
-
Open-source options allow experimentation and customization
Cons
-
Requires manual rule configuration and maintenance
-
Less automated anomaly detection compared with observability tools
Best for
Engineering teams implementing testing-driven data quality processes.
4. Bigeye

Bigeye focuses on monitoring analytics reliability across warehouse datasets and pipelines. The platform uses machine learning to automatically generate monitoring rules and detect anomalies in dataset behavior. It is commonly used by organizations building large analytics platforms that require consistent monitoring across multiple datasets.
Best features
-
Automated monitoring rules: Generates rules based on dataset behavior patterns.
-
Machine learning anomaly detection: Identifies unusual changes without manual configuration.
-
Dataset reliability dashboards: Visualize health metrics across datasets.
-
Cross-table monitoring: Tracks dependencies across warehouse tables.
-
Trend analysis: Provides insights into long-term data behavior.
Pros
-
Automated monitoring reduces manual rule creation
-
Strong visualization of reliability metrics
-
Suitable for growing analytics environments
Cons
-
Alert thresholds may require tuning over time
-
Primarily focused on observability rather than governance workflows
Best for
Organizations scaling analytics environments and needing automated monitoring.
5. Acceldata

Acceldata provides a broader platform that combines data observability with infrastructure monitoring. The platform analyzes both pipeline performance and dataset reliability, helping teams understand operational issues affecting analytics environments. It is often used in enterprise data platforms with complex infrastructure.
Best features
-
Pipeline and infrastructure monitoring: Tracks both data workflows and system performance.
-
End-to-end observability: Provides visibility across data and compute layers.
-
Reliability analytics: Analyzes patterns affecting dataset reliability.
-
Performance monitoring: Identifies bottlenecks in data pipelines.
-
Multi-platform support: Works across distributed data environments.
Pros
-
Comprehensive visibility across data and infrastructure layers
-
Useful for enterprise-scale data environments
-
Supports complex data architectures
Cons
-
A broader platform scope can increase implementation complexity
-
May require deeper operational expertise to deploy effectively
Best for
Large enterprises need combined data and infrastructure monitoring.
6. Great Expectations

Great Expectations is an open-source framework used to implement validation-based data quality testing in analytics pipelines. Teams define expectations about dataset structure, completeness, and behavior, and pipelines verify whether those expectations are met during execution. It is widely used by engineering teams building custom data quality workflows.
Best features
-
Expectation-based validation: Defines rules for structure, completeness, and accuracy.
-
Pipeline integration: Embeds validation checks into workflows.
-
Documentation generation: Creates data quality reports automatically.
-
Open-source ecosystem: Supports customization and community contributions.
-
Testing workflows: Enables structured data testing practices.
Pros
-
Highly customizable validation framework
-
Strong integration with engineering workflows
-
Open-source flexibility for building custom solutions
Cons
-
Requires engineering effort to implement and maintain
-
Limited automated monitoring compared with observability platforms
Best for
Teams building custom data quality frameworks with strong engineering support.
What implementation typically looks like for data product monitoring platforms
Most organizations implement data product monitoring platforms gradually rather than deploying them across the entire data ecosystem at once. A phased rollout allows teams to start with a small set of critical datasets or dashboards and evaluate how monitoring works in practice.
This approach helps teams validate the monitoring strategy, tune alerts, and focus on the data products that have the greatest business impact before expanding monitoring across the broader analytics environment.
Step 1: Identify critical data products
Implementation usually begins by identifying the most business-critical data products. These are assets that directly support decision-making or operational workflows.
Common starting points include executive dashboards, revenue and financial reporting datasets, customer analytics datasets, and machine learning feature pipelines.
Prioritizing these assets allows organizations to improve reliability where the business impact is highest. Monitoring these data products first helps teams quickly detect issues that could affect leadership reporting, operational metrics, or predictive models.
Step 2: Connect warehouses and pipeline systems
Once priority data products are identified, monitoring platforms are integrated with the organization’s data infrastructure. This typically includes cloud data warehouses, transformation frameworks, orchestration tools, and ingestion pipelines.
These integrations allow monitoring platforms to collect metadata, pipeline logs, and dataset statistics. By analyzing these signals, the platform can understand how data flows across systems and detect reliability issues across pipelines and datasets.
Step 3: Define data product quality checks and reliability thresholds
After integrating systems, teams define the criteria used to evaluate whether data products meet expected quality standards. These checks ensure that datasets remain consistent and usable across the analytics lifecycle.
Common configurations include:
-
Freshness expectations for when datasets should be updated
-
Acceptable variance ranges for key metrics.
-
Schema consistency rules to detect structural changes
-
Completeness checks for missing or incomplete data
These checks act as guardrails for data products. Instead of relying on manual validation, teams define clear expectations for how data should behave.
Once these thresholds are established, the platform continuously evaluates datasets against these standards, helping maintain consistency and reliability across analytics outputs.
Step 4: Integrate alerts and incident workflows
The final step involves connecting monitoring alerts with operational workflows. Alerts are typically integrated with collaboration tools such as Slack, ticketing systems, or incident management platforms.
This integration ensures that data reliability incidents are surfaced immediately and assigned to the appropriate data engineers or analytics teams. Over time, organizations refine alert thresholds and workflows so teams can respond quickly to issues while avoiding unnecessary alert fatigue.
|
Related resource:
OvalEdge explains in its whitepaper Implementing Data Access Governance how organizations ensure the right users have access to the right data while protecting data integrity across enterprise data platforms. |
How to evaluate data product quality management software
Selecting the right platform requires more than comparing feature lists. Organizations should evaluate how well a data product quality platform fits their existing data architecture, operational workflows, and long-term reliability goals.
Since monitoring platforms often become part of everyday data operations, the right choice should support both technical teams and analytics users.

1. Coverage across the data product lifecycle
Monitoring should extend across the entire analytics lifecycle, from data ingestion to downstream analytics outputs such as dashboards, BI datasets, and machine learning features.
Many reliability incidents occur downstream rather than in ingestion pipelines. For example, a schema change in a transformation layer can break several dashboards even though upstream pipelines are functioning normally. Platforms that monitor transformations, intermediate datasets, and analytics outputs provide more complete visibility across the environment.
Organizations should look for tools that can monitor both batch pipelines and streaming workflows, ensuring that all stages of the analytics lifecycle remain reliable.
2. Ease of configuration and operational overhead
Implementation complexity can significantly affect adoption. Some platforms require extensive rule configuration and ongoing maintenance, while others automatically profile datasets and generate monitoring signals.
Solutions that automate dataset profiling, anomaly detection, and rule generation help reduce the operational burden on data engineers. Lower maintenance overhead allows teams to focus more on analytics development rather than constantly managing and monitoring systems.
Ease of integration with existing infrastructure, such as warehouses, orchestration tools, and transformation frameworks, is also an important factor.
3. Incident response and troubleshooting workflows
Monitoring systems should not only detect issues but also help teams resolve them quickly. Effective platforms provide structured alerting, root cause analysis tools, and investigation workflows that help teams understand why a reliability issue occurred.
Features such as lineage-based debugging, incident tracking, and alert prioritization can significantly reduce the time required to resolve data issues. Platforms that integrate with incident management tools and collaboration platforms also help streamline communication during reliability incidents.
4. Visibility for both engineering and analytics teams
Data reliability affects multiple roles across the organization. Engineers maintain pipelines, analysts build dashboards, and data product managers oversee dataset usage.
Data product quality platforms should provide shared visibility into dataset health, pipeline performance, and reliability metrics. Dashboards that display dataset status, freshness indicators, and incident history help teams understand whether analytics outputs can be trusted.
Cross-team visibility also helps improve collaboration when resolving reliability issues.
5. Long-term adaptability as the data platform evolves
Data platforms evolve continuously as organizations add new data sources, pipelines, and analytics tools. Monitoring platforms should be able to adapt as the data ecosystem grows.
Organizations should evaluate whether the platform can support expanding architectures, additional data domains, and increasing data volumes. Tools that integrate with emerging technologies and support flexible monitoring frameworks are better suited for long-term reliability management.
Choosing a platform that scales alongside the organization helps ensure that product data reliability remains consistent as analytics environments become more complex.
Conclusion
Data products now play a central role in analytics, reporting, and AI systems. As data environments grow more complex, maintaining consistency and reliability across these products becomes increasingly challenging.
Data product quality management software helps organizations address this challenge by ensuring that datasets, dashboards, and analytics outputs remain accurate, consistent, and dependable.
Organizations that adopt these platforms often improve operational efficiency, reduce time spent validating data, and enable faster, more confident decision-making across teams.
Looking ahead, data product quality management is becoming a core part of modern DataOps and analytics operations. As organizations scale their data and AI initiatives, maintaining reliable data products will be essential for sustaining trust and performance.
Platforms like OvalEdge support this approach by combining data catalog, lineage, governance, and data quality capabilities in a single environment. This allows teams to manage data product reliability more effectively across the analytics lifecycle.
If you are exploring how to implement data product quality management in your organization, you can book a demo with OvalEdge to see how these capabilities work in practice.
FAQs
1. What is data product quality management software?
Data product quality management software helps organizations monitor and maintain the reliability of data products used in analytics and AI systems. It detects anomalies, validates data pipelines, tracks lineage, and alerts teams to issues that could affect dashboards, models, or operational decisions.
2. How is data product monitoring different from traditional data quality tools?
Traditional data quality tools focus on rule-based validation of datasets at specific checkpoints. Data product monitoring platforms continuously observe pipelines, transformations, and dependencies, automatically detecting anomalies and operational issues that may affect analytics reliability.
3. Which teams use data product reliability platforms?
Data product reliability platforms are typically used by data engineers, analytics engineers, data platform teams, and data product managers. These teams rely on monitoring tools to maintain reliable pipelines, ensure consistent metrics, and prevent disruptions to dashboards, reports, and machine learning workflows.
4. What metrics measure data product reliability
Common reliability metrics include data freshness, volume stability, schema consistency, anomaly frequency, and pipeline uptime. These indicators help teams track whether datasets arrive on time, maintain expected patterns, and remain consistent across transformations and analytics systems.
5. How does data lineage improve data monitoring?
Data lineage maps how data flows across pipelines, transformations, and analytics outputs. By showing upstream and downstream dependencies, lineage helps teams quickly identify the root cause of anomalies and understand which dashboards or models may be affected.
6. Can data observability platforms replace governance tools
Data observability platforms focus on monitoring operational health and detecting anomalies in pipelines. Governance tools manage definitions, ownership, policies, and access controls. Most organizations use both together to maintain reliable data products and enforce consistent data standards.

.png?width=1081&height=173&name=Forrester%201%20(1).png)
.png?width=1081&height=241&name=KC%20-%20Logo%201%20(1).png)