-1.png)
Enterprises rarely struggle because they lack metrics. They struggle because the same metric is defined differently across teams and tools. Revenue may follow one formula in finance, another in sales, and a third in a BI dashboard. This inconsistency becomes riskier as self-service analytics and AI agents rely on shared business context.
A 2026 study by Harvard Business Review Analytic Services and Cloudera found that only 7% of enterprises consider their data completely ready for AI, highlighting the gap between AI ambition and trusted data foundations.
A semantic layer addresses this problem by standardizing business meaning across data systems, BI tools, dashboards, and AI interfaces. This guide explains its components, types, use cases, vendor categories, future trends, and where OvalEdge fits through metrics governance.
What is a semantic layer?
A semantic layer is a business meaning layer between raw enterprise data and the tools used to consume it. It converts tables, columns, joins, and SQL logic into business terms, metrics, dimensions, and relationships so we can define key measures once and reuse them across dashboards, reports, applications, and AI agents.
The role of a semantic layer
A semantic layer translates technical data structures into business concepts that teams can understand and query without knowing every table, column, join, or SQL rule. It converts raw schema details into approved metrics, dimensions, entities, relationships, and calculation logic that can be reused across dashboards, reports, applications, and AI interfaces.
This shared layer reduces duplicated work because teams no longer need to rebuild the same KPI in each tool. It also limits reporting conflicts by making definitions, filters, exclusions, aggregation rules, and time periods consistent. Instead of finance, sales, and operations calculating net revenue separately, one approved definition can be applied across every authorized use case.
A semantic layer also gives AI agents more reliable context. It tells systems what business terms mean, how metrics are calculated, which relationships are valid, and which definitions should be used for a specific question.
Implementation tip: OvalEdge’s Business Glossary helps teams document and govern the business meaning that supports a semantic layer. It can connect official terms and metrics with definitions, synonyms, calculation references, owners, stewards, approval status, and usage guidance.
This gives business users, analytics teams, and AI systems a shared reference for terms such as revenue, customer, churn, and margin. It also helps teams identify which definition is approved when the same term carries different meanings across departments or systems.
Why do enterprises need a semantic layer?
As organizations scale, teams often recreate the same business logic across tools, models, and reports. A semantic layer reduces this inconsistency by giving us one approved meaning for key metrics.
It helps enterprises:
-
Standardize metric definitions: Align revenue, churn, active customer, gross margin, conversion rate, customer lifetime value, and risk score.
-
Reduce reporting conflicts: Prevent finance, sales, product, and marketing from presenting different KPI results.
-
Support self-service analytics: Let users explore data through predefined, governed calculations.
-
Improve AI reliability: Give AI agents approved metrics, synonyms, business context, and access rules.
-
Strengthen governance: Connect definitions with ownership, certification, quality checks, policies, and data lineage.
Semantic modeling makes metrics reusable. Metrics governance makes those definitions trusted, traceable, and approved.
Semantic layer vs metrics layer vs metrics governance
These categories overlap, but they solve different problems. A semantic layer vendor models business meaning, a metrics layer standardizes calculations, and metrics governance determines whether those definitions are approved, traceable, and trusted.
The comparison shows where each category fits:
|
Concept |
What it does |
Main question |
Example fit |
|
Semantic layer |
Defines metrics, dimensions, joins, and relationships |
What does the data mean? |
Cube, AtScale, Snowflake, Databricks |
|
Metrics layer |
Creates reusable KPI calculations |
How is this KPI calculated? |
dbt Semantic Layer, MetricFlow, Cube |
|
Metrics governance |
Manages ownership, lineage, certification, quality, and approval |
Can this metric be trusted? |
OvalEdge |
A semantic layer makes metrics reusable. Metrics governance makes them reliable. OvalEdge helps teams reduce KPI disputes, identify approved definitions, trace metrics to source data, and provide BI tools and AI agents with governed metrics backed by ownership, quality context, and certification.
What are the core components of a semantic layer?
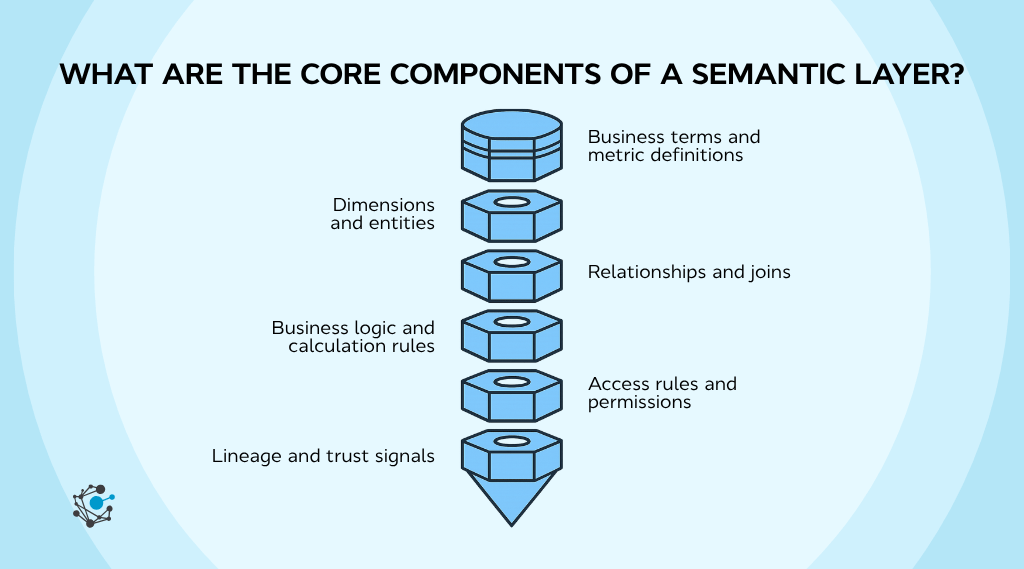
A semantic layer combines several building blocks that make enterprise data easier to understand, query, and reuse across BI, analytics, applications, and AI systems. Each component handles a specific part of business meaning, calculation logic, access, or trust.
1. Business terms and metric definitions
Business terms and metric definitions provide the approved language used across reports and analytics tools. They include business-friendly names, descriptions, synonyms, formulas, KPI references, owners, and usage guidance.
This component helps teams avoid vague or conflicting terms. For example, “revenue” should state whether it refers to gross revenue, net revenue, booked revenue, recognized revenue, or recurring revenue.
2. Dimensions and entities
Dimensions and entities represent the business objects used to organize data. Common examples include customer, product, account, region, order, supplier, claim, policy, and transaction.
They help users group, filter, compare, and segment metrics. A revenue metric, for instance, may be analyzed by customer, product category, sales region, or reporting period.
3. Relationships and joins
Relationships and joins define how business entities connect across tables and systems. Examples include customer to order, account to subscription, policy to claim, and campaign to lead.
This component tells analytics tools which records belong together and which join path should be used. Standardized relationships reduce duplicate counts, missing records, and inconsistent results across dashboards.
4. Business logic and calculation rules
Business logic defines how metrics are calculated and interpreted. It includes formulas, filters, aggregation rules, exclusions, time windows, thresholds, and derived calculations.
For example, monthly active users may depend on login activity, product usage, account status, and a fixed reporting period. Defining these rules once prevents separate teams from creating competing versions of the same KPI.
5. Access rules and permissions
Access rules control who can view or query specific metrics, dimensions, and records. They may include role-based access, field-level restrictions, privacy controls, compliance rules, and department-specific permissions.
This component allows the same semantic model to serve multiple users without exposing sensitive financial, customer, employee, or regulated data to unauthorized teams.
6. Lineage and trust signals
Lineage shows where a metric originates, how it is transformed, which systems feed it, and which dashboards, reports, or AI outputs consume it. Trust signals add context such as ownership, certification status, quality scores, and approval history.
Together, they help users verify whether a metric is current, reliable, and approved for use. They also support impact analysis by showing which reports may be affected when a source, formula, or definition changes.
What are the different types of semantic layers?
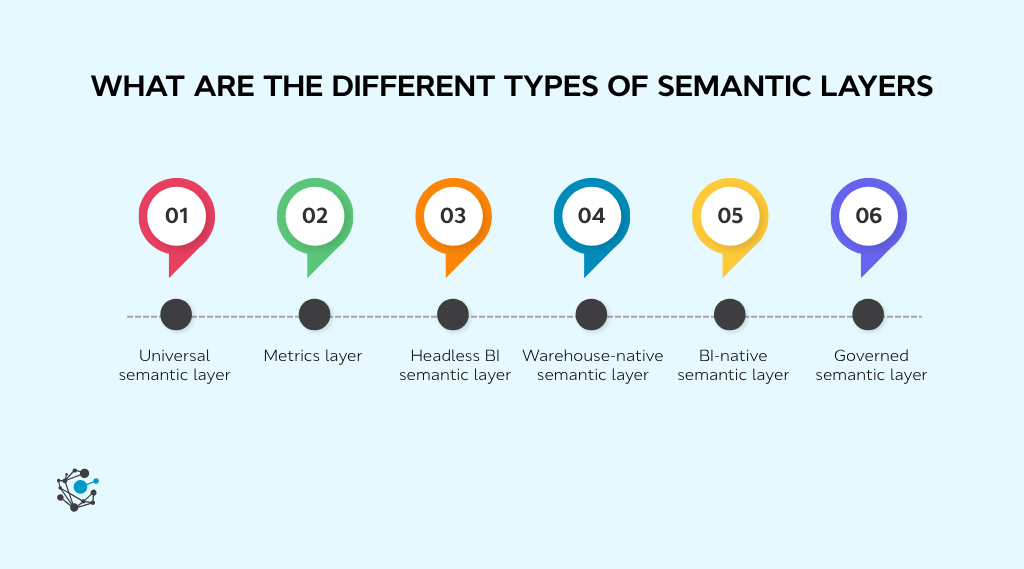
A semantic layer is not one fixed product category. Some tools focus on defining metrics, some separate business logic from BI interfaces, and others add governance controls around ownership, lineage, certification, and policy. The right model depends on where metric logic should live, who maintains it, and which systems must consume it.
1. Universal semantic layer
A universal semantic layer creates a centralized, tool-agnostic model for metrics, dimensions, relationships, and business logic. It lets the same definitions serve multiple BI platforms, analytics applications, data products, and AI interfaces.
This model works well when an enterprise uses several reporting tools and wants to prevent each one from creating its own version of revenue, churn, or margin. Cube and AtScale are common examples. They provide a shared semantic model that can sit between enterprise data platforms and downstream consumption tools.
Best fit: Large enterprises with multiple BI tools, distributed analytics teams, and cross-functional reporting requirements.
2. Metrics layer
A metrics layer focuses more narrowly on reusable metric calculations. It defines how a KPI is calculated, including formulas, filters, aggregation logic, time windows, and dimensions.
dbt Semantic Layer and MetricFlow suit analytics engineering teams that prefer metrics-as-code, version control, testing, and deployment through existing transformation workflows. The primary benefit is calculation consistency across dashboards, notebooks, and analytics tools.
Best fit: Teams that already manage transformations in code and need a controlled way to define and reuse KPIs.
3. Headless BI semantic layer
A headless BI semantic layer separates business logic from the front-end reporting tool. Instead of storing definitions inside one dashboard platform, it exposes metrics through APIs, SQL interfaces, or reusable services.
This approach supports embedded analytics, customer-facing dashboards, internal data applications, and AI-powered query experiences. Cube is often associated with this model because it can serve standardized metrics to several downstream interfaces.
Best fit: Product and data teams building analytics experiences outside a traditional BI platform.
4. Warehouse-native semantic layer
A warehouse-native semantic layer stores metric definitions, dimensions, entities, and relationships inside the cloud warehouse or lakehouse. This keeps semantic logic close to the underlying data and reduces the need for a separate serving layer.
Snowflake Semantic Views and Databricks Metric Views fit this category. They work well when most data workloads already run on one platform and teams want to manage semantic definitions within that environment.
Best fit: Organizations standardized on a single cloud data platform.
5. BI-native semantic layer
A BI-native semantic layer is built directly into a reporting or analytics platform. Looker, Omni, Sigma, and Power BI semantic models let teams define business logic close to the dashboards and reports that use it.
This model can simplify development when most users work inside one BI ecosystem. The main limitation is portability. Definitions may become tied to the BI tool unless they are also documented and governed outside that platform.
Best fit: Organizations with one dominant BI platform and limited need to reuse definitions elsewhere.
6. Governed semantic layer
A governed semantic layer adds ownership, approval, lineage, certification, quality, access control, and policy context around metric definitions. It answers more than how a KPI is calculated. It also establishes who owns it, whether it is approved, where it comes from, and which users or AI agents may access it.
OvalEdge fits this category through metrics governance rather than acting as a pure semantic query engine. It helps teams connect governed metrics with glossary definitions, source-to-report lineage, stewardship, certification, and quality context through its business glossary.
Best fit: Enterprises that need metrics to be trusted, traceable, auditable, and safe for both BI and AI use.
What are the top semantic layer use cases?
Semantic layers are most useful when metrics must remain consistent across teams, tools, and consumption channels. Common use cases include:
-
Consistent BI reporting: Align dashboards across finance, sales, marketing, product, and operations.
-
Executive KPI governance: Apply approved definitions to board reports, financial dashboards, and operating reviews.
-
Self-service analytics: Let business users explore governed metrics without rebuilding calculations.
-
AI agents: Provide trusted definitions and relationships for natural language queries.
-
Embedded analytics: Serve consistent metrics inside applications and partner portals.
-
Data product management: Make data products easier to understand and reuse.
-
Audit readiness: Connect reported metrics to ownership, certification, and source data.
Across these use cases, the semantic layer provides a shared business meaning that keeps analytics accurate, reusable, and consistent wherever metrics are consumed.
What are the future trends in semantic layers?
Semantic layers are expanding beyond BI reporting into AI-ready semantic infrastructure. Their role will shift from standardizing dashboard calculations to supplying consistent business context across data platforms, analytics tools, applications, data products, and AI agents.
Several trends will shape this shift:
-
Semantic layers for AI agents: AI agents need approved metric definitions, synonyms, relationships, business rules, and access context. Raw schemas identify tables and columns, but they do not explain what a term means or which calculation should be used.
-
Open semantic standards: Shared formats such as OSI will help platforms exchange metrics, dimensions, entities, and relationships without rebuilding the same semantic definitions in every tool.
-
Metric portability: Enterprises will expect metric definitions to work across warehouses, BI platforms, catalogs, notebooks, applications, and AI interfaces. Portability reduces duplicated logic and limits dependence on one vendor.
-
Governed semantic layers: Reusable definitions will also require ownership, certification, lineage, quality signals, access rules, and policy approval. Governance must continue as definitions, source data, and business requirements change.
-
Business glossary and semantic layer convergence: Glossaries, catalogs, lineage, and semantic models will become more connected. This gives business users and AI systems the same definitions, relationships, ownership details, and trust signals.
The next stage is not limited to defining metrics once. Enterprises must keep those definitions governed, traceable, portable, and fit for use as analytics and AI requirements change.
How does OvalEdge support semantic layer and metrics governance initiatives?
OvalEdge supports semantic layer initiatives by helping teams govern the business meaning around metrics. It is most relevant when enterprises need glossary-defined metrics, lineage-backed definitions, ownership, certification, quality context, and governance workflows.
Its metrics governance capabilities help teams:
-
Reduce definition conflicts: A business glossary records official metric names, synonyms, calculation references, owners, and approved usage.
-
Trace every metric: Lineage connects source systems, transformations, dashboards, reports, and AI outputs.
-
Clarify accountability: Owners and stewards approve changes and resolve disputes.
-
Identify trusted metrics: Certification shows which definitions are approved for executive reporting, compliance, and AI.
-
Protect metric reliability: Quality checks, access rules, privacy context, and policies support safe use.
OvalEdge expert opinion: A semantic layer can tell AI what data means, but governance rules determine which meaning it should use. “Customer” may refer to an account, billing entity, user, tenant, or governed warehouse record. AI needs an approved business context before selecting the correct definition.
OvalEdge is not a pure semantic layer engine. It helps enterprises govern semantic meaning so metrics become trusted, traceable, certified, and ready for BI and AI.
Conclusion
Semantic layers are becoming a core part of AI-ready data architecture. As more teams rely on natural language analytics and AI agents, reusable metric logic will not be enough. Enterprises will also need clear ownership, lineage, certification, quality signals, and business rules that tell systems which definition to use in each context.
If teams are still reconciling conflicting KPIs, tracing numbers manually, or questioning whether AI outputs use approved definitions, the issue may be metrics governance rather than metric calculation alone.
Schedule a demo with OvalEdge to see how governed metrics can improve trust across BI, executive reporting, and AI.
.png?width=1081&height=173&name=Forrester%201%20(1).png)
.png?width=1081&height=241&name=KC%20-%20Logo%201%20(1).png)