.png)
Metadata analytics separates a data estate that can be governed from one that is only documented. Most enterprises already capture metadata at scale, since schemas, access logs, pipeline schedules, and lineage records accumulate automatically across every connected platform.
Far fewer analyze that material, which is why governance programs get stood up and then stall. Stewards work through backlogs by hand, leadership asks what the program has delivered, and the catalog turns into one more system to maintain. Analysis is what converts the captured material into decisions about priority, risk, and spend.
This guide covers the metadata types that matter, how the analysis runs, the operational problems it solves, and what shifts as AI agents start consuming governed data.
What is metadata analytics?
Metadata analytics is the practice of analyzing metadata to produce operational decisions about which data can be trusted, which pipelines need attention, and who owns each asset. Metadata is the descriptive, structural, and operational information that every table, dataset, and pipeline generates automatically. A catalog stores that material as documentation. Analysis reads it as evidence, which turns it into an active decision layer.
Metadata analytics answers three questions across every connected system:
-
What data exists, and where does it live? Catalog coverage, ownership, and location across warehouses, lakes, Software as a Service (SaaS) tools, Business Intelligence (BI) layers, and AI pipelines.
-
How does it flow and transform? Lineage from the source table through every transformation to the dashboard or model that consumes it.
-
Can it be trusted for the decision at hand? Freshness, schema stability, quality signals, and certification status read together.
Five types of metadata that power metadata analytics
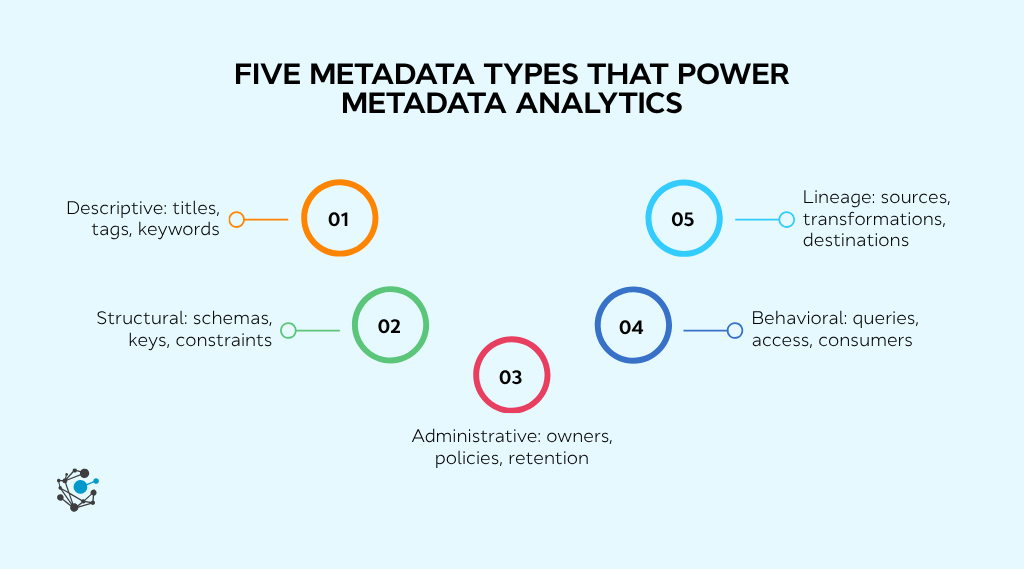
Metadata analytics draws from five categories: descriptive, structural, administrative, behavioral, and lineage. Each offers a different lens into the data estate, and a practice built on only two or three of these types of metadata carries predictable blind spots.
Descriptive metadata
Descriptive metadata identifies and categorizes data assets: titles, tags, keywords, authorship, creation dates, and subject classification. These attributes decide whether a dataset surfaces at all when someone searches the data catalog. When a financial analyst looks for quarterly revenue figures, descriptive metadata determines which datasets appear and how they rank.
Structural metadata
Structural metadata defines how data is organized internally: table schemas, column relationships, primary and foreign keys, data types, and constraints. Analysis of these signals detects schema drift, meaning a column type changes or a table gets renamed without warning. A Customer_ID stored as text in a Customer Relationship Management (CRM) system and as an integer in billing is the kind of mismatch that breaks integrations later.
Administrative metadata
Administrative metadata tracks the management lifecycle: who created a dataset, who owns it, what access policies apply, when it was last modified, and what retention rules govern it. Organizations subject to the General Data Protection Regulation (GDPR) or the Health Insurance Portability and Accountability Act (HIPAA) rely on it to maintain audit trails and enforce column-level access controls.
Behavioral metadata
Behavioral metadata captures how data gets used: query frequency, access patterns, downstream consumption, and user interactions. It answers which datasets drive decisions, which owners field the most questions, and which reports run every morning before the executive meeting. Usage is the signal that tells a governance team where to spend effort first.
Lineage metadata
Lineage metadata traces the journey of data from source to final destination, mapping every transformation, aggregation, and movement across pipelines, Extract-Transform-Load (ETL) processes, and reporting layers. Data lineage is what makes root cause analysis possible, since a wrong number in a report can be traced back to the transformation that introduced it.
How metadata analytics works
Metadata analytics moves through three stages: collection and aggregation, analysis and pattern detection, and activation. Each one builds on the previous.
Stage 1: Collection and aggregation
Metadata analytics begins with connecting to data sources and extracting metadata. Modern platforms use automated crawlers and API-based connectors to pull technical, operational, and administrative metadata from databases, warehouses, BI tools, pipelines, and SaaS applications into a unified repository.
The goal is a single, searchable metadata layer that spans every connected system. Without it, metadata stays fragmented: warehouse schemas in one tool, BI report definitions in another, pipeline schedules in a third, and access logs in a fourth. A unified repository brings all of these signals together, normalizes formats, and makes cross-system analysis possible. Organizations with broad connector coverage capture a more complete picture. Unified platforms with pre-built connectors spanning cloud-native platforms, legacy databases, and hybrid architectures reduce the engineering effort required to build this foundation.
Stage 2: Analysis and pattern detection
Once centralized, metadata is analyzed through several techniques:
-
Lineage graph analysis: Parsing SQL, ETL definitions, and pipeline configurations to map data flows from source to consumption, including automated column-level lineage derived from source code parsing.
-
Usage pattern analysis: Tracking query frequency, access patterns, and consumer counts to separate high-value assets from abandoned ones.
-
Quality signal monitoring: Measuring metadata completeness, freshness, schema stability, and consistency across systems.
-
Classification inference: Using column names, data patterns, and context to detect and classify sensitive data (Personally Identifiable Information, Protected Health Information, Payment Card Industry data) through AI-powered classification using ML classifiers and configurable policies.
Stage 3: Activation and operational integration
Raw analysis becomes valuable when it drives action. The activation stage embeds metadata intelligence into governance dashboards, policy enforcement engines, data quality alerts, and the tools where data consumers already work.
This stage follows a Crawl, Curate, Consume model. In Crawl, the platform connects to every source and automatically builds an inventory with lineage and relationships. In Curate, built-in governance agents handle the heavy lifting: Curo enriches catalog entries with missing metadata and business context, Sift detects and classifies sensitive data at scale, and Litmus recommends data quality rules based on schema patterns and existing issues. Stewards validate and approve each recommendation. In Consume, data teams, analysts, and AI agents find, trust, access, and act on governed data.
Six ways organizations use metadata analytics
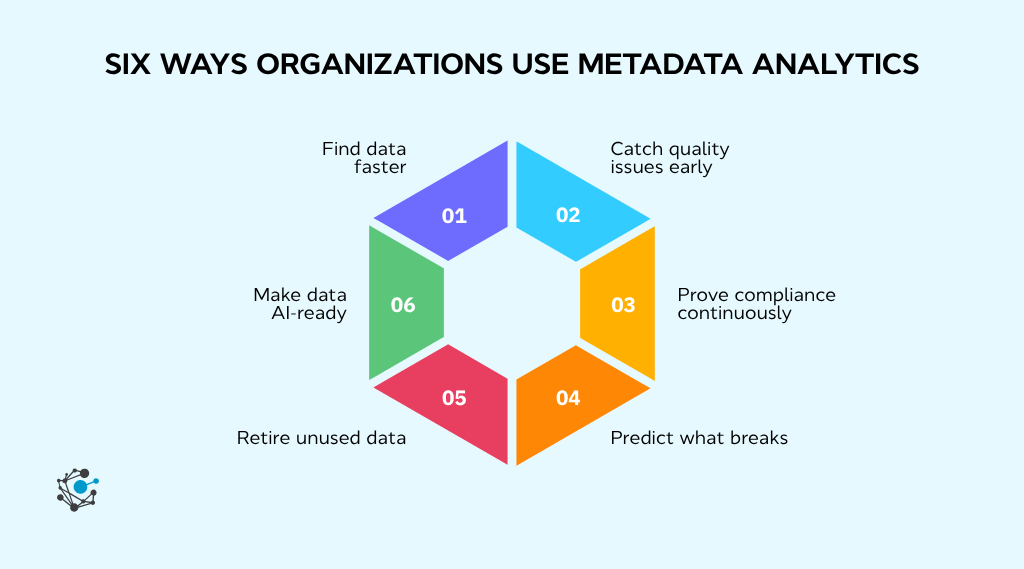
Organizations apply metadata analytics to accelerate data discovery, detect quality issues before they reach reports, enforce continuous compliance, run impact analysis ahead of upstream changes, cut storage costs by retiring unused data, and build AI-ready governed foundations.
Each use case below starts with what the practice does, then the problem behind it, and what changes operationally.
1. Accelerating data discovery across scattered systems
Metadata analytics accelerates discovery by ranking datasets on evidence, using popularity, freshness, ownership clarity, and documentation completeness to decide what a search returns first.
Data teams spend a disproportionate amount of time hunting for the right dataset. The gap is context, since thousands of datasets sit across warehouses, lakes, and SaaS tools with thin descriptions, unclear ownership, and no quality signals attached. Ranking changes the default. Trusted, frequently consumed assets surface at the top, and stale or duplicate datasets carry a visible signal instead of looking identical to everything else in the results.
Forrester TEI (March 2022) measured up to 30% improvement in analyst productivity, attributed to self-service access, better data quality, and timeliness.
2. Detecting data quality issues before they reach reports
Metadata analytics catches quality problems by monitoring schema changes, refresh failures, null rate spikes, and conflicting definitions across business glossaries, then alerting the steward who owns the asset.
Quality problems hide in the gaps between systems. One department defines "active customer" as anyone who logged in within 30 days, while another uses 90. A pipeline silently changes a column's data type. A scheduled refresh fails overnight, and nobody notices until a dashboard shows stale numbers the next afternoon.
Each of those is invisible inside any single tool and obvious across a unified metadata layer. Detection moves upstream of the report, so a steward hears about schema drift before an analyst has to explain a wrong number in a meeting.
3. Enforcing governance and maintaining continuous compliance
Metadata analytics turns compliance into continuous monitoring by showing which datasets hold sensitive information, who can reach them, and where classification policies have gaps.
Governance programs run on assumptions when evidence is expensive to gather. For financial services firms under the Sarbanes-Oxley Act or healthcare organizations subject to HIPAA, that means a periodic audit exercise producing a snapshot that goes stale the week after sign-off.
Lineage carries the burden of proof. When an auditor asks how a figure in a regulatory filing was derived, the chain runs from the source table through every transformation rule to the final aggregation. Privacy and compliance work in healthcare rest on the same chain, showing that patient data feeding a clinical dashboard was handled correctly at every stage.
Forrester TEI documents a sharp first-year reduction in the effort to find, tag, and secure sensitive data once classification is automated, with smaller gains in later years as the estate stays clean.
4. Running impact analysis before upstream changes break dashboards
Impact analysis reads lineage in reverse, listing every downstream report, dashboard, and data product that depends on an asset before anyone changes it.
Before modifying a source table, adding a column, or deprecating a pipeline, data engineers need to know what depends on it. Without that map, a routine change lands blind. Renaming one column in a billing table can quietly break a revenue dashboard, three finance reports built on it, and a forecasting model reading the same field, with the failure surfacing days later during a month-end close.
The dependency chain answers the question before the change ships. Engineers see the blast radius, notify the owners of affected assets, and schedule the work for when downstream teams can absorb it.
5. Cutting storage and compute costs by retiring unused data
Metadata analytics finds the storage and compute nobody is watching, flagging unused tables, inactive dashboards, and redundant pipelines as candidates for archival or retirement.
Redundant, obsolete, and trivial data accumulates quietly. Cloud platforms charge for storage and compute regardless of whether anyone queries the table, so waste compounds without ever appearing as a line item anyone owns.
Evidence makes the cleanup defensible. A table with no queries in eighteen months and no downstream dependencies is a safe retirement candidate. A table with low query volume and a live link to a regulatory report is a trap. Teams that can tell those apart archive with confidence, which is the difference between a cost program that holds and one reversed after the first broken dashboard.
6. Building AI-ready, governed data foundations
Metadata analytics makes data AI-ready by checking training inputs against quality, freshness, and lineage standards before a model is built, then tracing model outputs back to their sources afterwards.
AI models are only as reliable as the data they train on, and most training sets get assembled faster than they get verified. Explainability depends on the same metadata. When a model produces a questionable output, lineage traces the result back through every source and transformation that contributed to it, which turns a disputed number into a fixable one.
Agentic systems raise the stakes further, since an agent consuming governed data autonomously has no judgment to fall back on when a dataset is stale or misclassified.
Metadata analytics in the AI agent era
Analysts, stewards, and engineers are no longer the only metadata consumers. AI agents read the same context to decide what a query should return.
Most of what agents require already exists. Catalog, lineage, quality, certification, and access controls apply without redesign, provided they are complete, accurate, and exposed through programmatic interfaces. Context assembly, agent permissions, and tool-use governance are the genuinely new requirements, and metadata analytics is what connects the two layers.
Context must be machine-readable
A human reading a catalog entry fills gaps from experience. An agent has none, so every definition, semantic mapping, and quality signal has to be explicit and structured before it can be used. Platforms like OvalEdge expose governed enterprise context, including glossary terms, lineage, quality scores, and certifications, to models and agents through a Model Context Protocol (MCP) server and an open context API.
Lineage must extend to AI outputs
When an agent produces a recommendation, the question that follows is which data produced it. Lineage inferred from runtime logs answers at the table level and loses the column-level detail an auditor asks for. Source code intelligence derives lineage directly from SQL, Python, ETL, and BI report code, which gives audit teams ground-truth lineage down to the column.
Governance must apply to agent actions
An agent should never hold more authority than the user, role, or workflow it represents. That constraint only holds if the agent reads policy from the same source as the rest of the estate, since a separate permission model drifts. An Enterprise Context Graph links ontology, glossary, lineage, catalog, quality, and policy into one evolving graph, so every agent works from the same governed context and the same guardrails.
Certification must gate what agents can use
A human analyst hesitates over a dataset that looks wrong. An agent proceeds. Certification is the signal that replaces that hesitation, marking which assets have been validated for analytics, reporting, and model training. Certified datasets carry trust scores assigned by governance agents and validated by stewards, which an agent checks before it acts.
Metadata analytics vs. metadata management
Metadata management is the practice of capturing, storing, and organizing metadata. Metadata analytics is the practice of reading metadata for patterns and converting them into operational decisions. The same boundary separates data catalogs from metadata management tools.
|
Dimension |
Metadata management |
Metadata analytics |
|
Core activity |
Capturing, storing, and organizing metadata |
Reading stored metadata for patterns |
|
Output |
A catalog or repository |
Signals, scores, and rankings |
|
Method |
Documentation and maintenance |
Detection, comparison, and scoring |
|
Success looks like |
Coverage and accuracy of the record |
Decisions changed by what the record shows |
|
Role for AI |
Supplies the underlying record |
Exposes context agents can read |
Organizations need both. Management keeps the record complete and accurate. Analytics decides what to do about what the record shows. Buying one and assuming it delivers the other is the most common evaluation mistake in this category.
Implementing metadata analytics
Implementation runs in three moves: decide what metadata matters and why, choose a platform that covers the whole layer, then plan for the resistance every rollout meets.
Start with a metadata strategy
A metadata strategy names what gets captured, who governs it, and which business outcome it serves. Mandatory attributes should be standardized across the entire estate: data type, source, owner, sensitivity classification, and update frequency.
Tie the strategy to one objective before expanding. Compliance-led programs start with classification, lineage, and access controls. Discovery-led programs start with ownership and documentation coverage.
Also Read: This guide on enterprise metadata management strategy covers the full sequence.
Choose a platform that unifies the layer
Catalog, lineage, quality, access, and policy belong in one operating layer. Stitching point solutions together turns the governance team into an integration team.
Four criteria carry the most weight in evaluation:
-
Source coverage across cloud, on-premises, and legacy systems
-
Automation depth for classification, lineage extraction, and quality monitoring
-
Workflow integration with systems already in daily use, such as Jira and ServiceNow
-
Usability for people who do not write SQL
Plan for the common blockers
Three obstacles show up in almost every rollout.
Data silos are the most persistent, and the fix is organizational as much as technical, since source owners have to agree to expose their data before any connector helps.
Adoption resistance is the second. Governance that lives in a separate interface is only ever used by the governance team. A structured data catalog implementation plan that delivers visible wins in the first few weeks does more for adoption than a mandate.
Skill gaps are the third. Pairing internal training with data literacy programs closes them faster than recruiting for them.
A phased rollout that starts with one high-impact domain gets a working practice live in weeks, which keeps executive sponsorship intact while coverage expands.
Metadata analytics for operational data governance
Metadata analytics shifts data governance from a documentation exercise into an operational discipline. Instead of cataloging metadata and hoping teams follow policy, organizations gain continuous visibility into lineage dependencies, quality signals, ownership gaps, and usage patterns across every connected system. That visibility turns a passive catalog into an active decision layer where every dataset carries the context it needs to be used with confidence. As AI agents begin consuming data autonomously, the operational bar rises further: agents need certified, well-governed data delivered programmatically, not a search interface.
OvalEdge unifies metadata analytics across catalog, lineage, quality, access, and policy, with governance agents that automate enrichment, classification, and quality rule recommendations.

Book a demo to see how metadata analytics converts raw metadata into a governed, AI-ready data estate.
.png?width=1081&height=173&name=Forrester%201%20(1).png)
.png?width=1081&height=241&name=KC%20-%20Logo%201%20(1).png)